
Executive Summary
Market Performance: Strong gains so far this year in large technology companies, with NASDAQ 100 Index up over 40% year-to-date, but mixed performance in other categories like dividend-paying and small US companies as well as emerging markets.1Source: YCharts as of 09/13/2023. The ETFs presented above are not intended to be benchmarks for performance. Rather, they are intended to be demonstrative of a particular sector or segment the investment universe discussed. Each ETF was selected as opposed to an index to more accurately reflect what an investor might experience. There are other ETFs or indices that might be representative of the same spaces. However, we believe the ones shown are sufficiently representative to assist us in explaining our investment thesis.
Inflation data for August showed a 3.7% increase in household good prices year-over-year, higher than market expectations.2Bureau of Labor Statistics Inflation remains above desired levels. Housing and gasoline prices are key drivers of higher prices.
The potential for an economic downturn remains present due to factors like higher interest rates, rising consumer debt, and other financial strains on households like rising energy prices and slowing employment growth.
Long-term Economic Outlook: In the long run, innovation and other factors will likely contribute to economic growth. “Time in the market” is generally better than trying to “time the market.”
Portfolio Positioning: Dividend stocks may be attractive today given the income they provide and their tendency to be more resilient during economic downturns. Investors should stay diversified and focused on long-term goals, especially given the uncertain economic conditions.
2023 Year-to-Date Summary (as of 9/13/23)
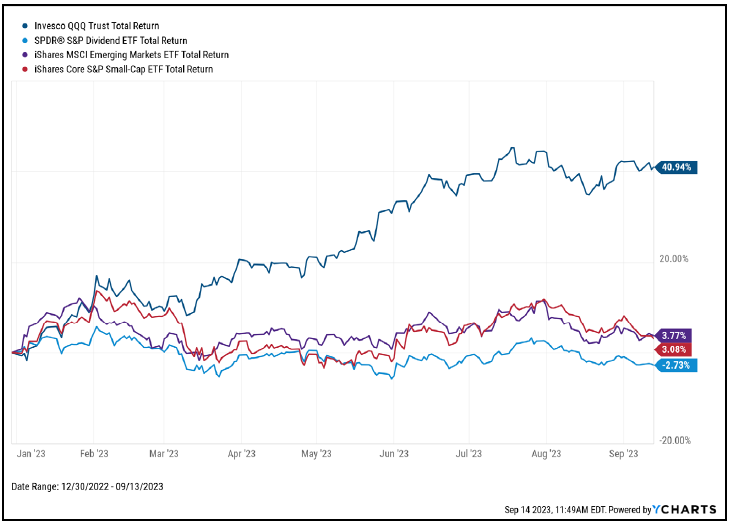
2023 for investors has been a good year or mediocre year depending on what part of the market you are investing in. It has been an incredible year for large cap technology stocks, with the NASDAQ 100 Index up more than 40% year-to-date through mid-September. Other stock categories such as dividend paying stocks, emerging market stocks, and small cap stocks are only slightly up or negative in the case of dividend paying stocks3Source: YCharts as of 09/13/2023. The ETFs presented above are not intended to be benchmarks for performance. Rather, they are intended to be demonstrative of a particular sector or segment the investment universe discussed. Each ETF was selected as opposed to an index to more accurately reflect what an investor might experience. There are other ETFs or indices that might be representative of the same spaces. However, we believe the ones shown are sufficiently representative to assist us in explaining our investment thesis.. Bonds, which had a more promising start to the year are also experiencing an anemic 2023, up 0.7% through mid-September.
Inflation Update
On September 13, 2023 the Bureau of Labor Statistics released the Consumer Price Index (CPI) data for August. The headline numbers came in slightly higher than markets were anticipating, with a 3.7% increase from the one year ago. Inflation remains above the Federal Reserve’s goal of approximately 2 percent annual inflation. The drivers of upside inflation included the recent surge in gasoline prices and continued gains in rent and housing related pricing. Although on the surface, these numbers were received negatively by the markets, core inflation (ex food and energy) has continued to decline and there was nothing in the numbers that seem likely to result in a more aggressive interest rate policy from the Federal Reserve. We also believe that the housing related components of CPI are likely experiencing a lag effect where they are contributing more to the official inflation report than the real time data would imply.
Recession Outlook
Goldman Sachs made headlines recently by further lowering their recession probability forecast over the next year to just 15%.4https://finance.yahoo.com/news/goldman-sachs-lowers-recession-chances-to-15-153737400.html In addition, the consensus number of economists polled by Bloomberg calling for a recession has recently begun to fall. While this may seem encouraging, we believe that the odds of a recession remain fairly elevated and could actually be increasing at a time when markets appear to be increasingly less worried about this outcome.
Since early 2022, economists and market forecasters began calling for a recession. Markets faced many headwinds at that time like the Ukraine War, inflation, and restrictive monetary policy. Markets declined more than 20% from their 2021 peak, but we believed the economy was resilient and could weather these storms. As the data continued to prove that thesis, markets recovered through the end of 2022 and into 2023. Even the collapse of Silicon Valley Bank in March of this year and the resulting drastic slowdown in banking activity hasn’t stopped this economy.
We believe that while markets now expect clear sailing ahead, the headwinds of higher interest rates at loan resets, record levels of consumer credit card balances, and reinstatement of student loan repayments are factors that could push the economy into a mild recession in 2024.
What Factors Could Lead to a Recession in 2024?
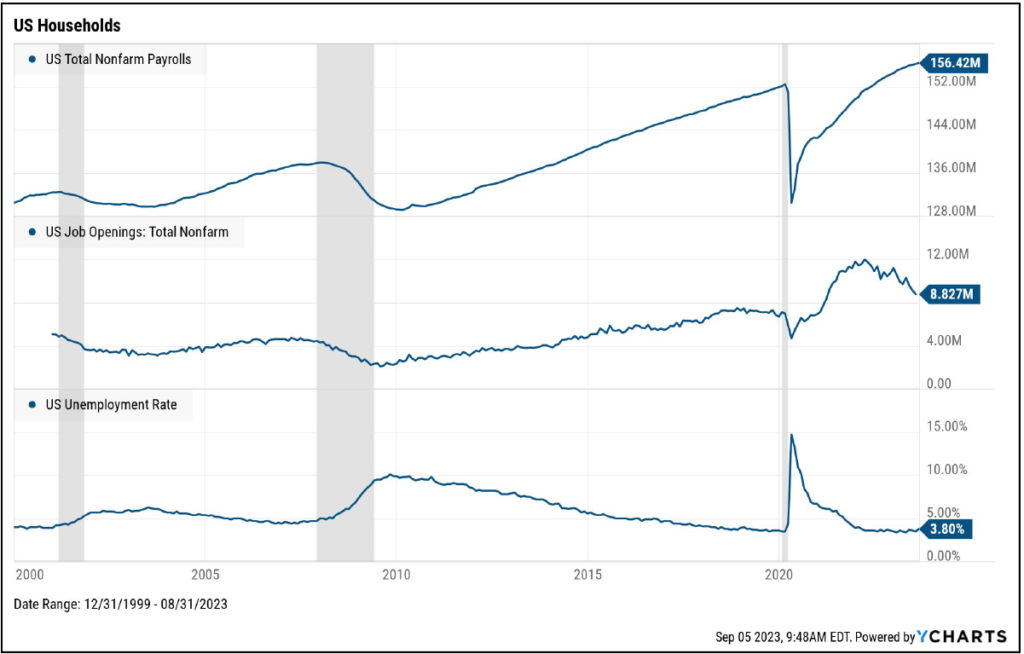
- Employment: strong but starting to show signs of slowing through slightly higher unemployment and lower job openings.
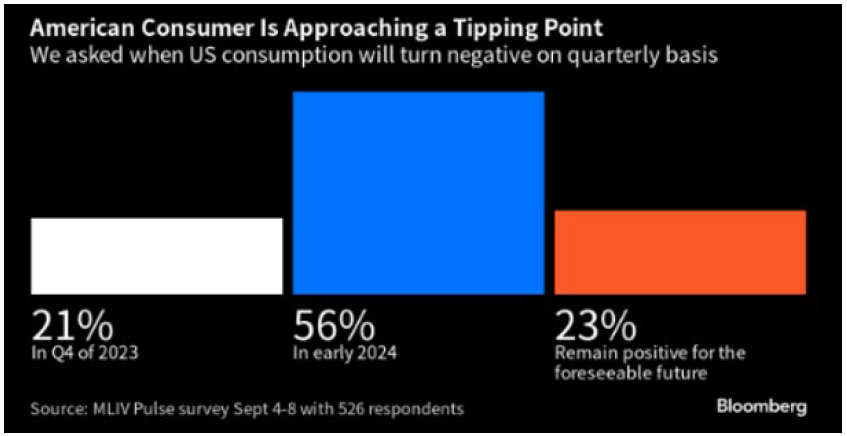
- Households: showing signs of increasing financial strain in the form of lower savings rates, higher credit card balances, declining spending, and below-average sentiment. In other words, more spending has gone on credit cards, so future spending will have to slow to repay that debt.
- Inflation: showing signs of softening, but energy prices have begun to rise again, which could serve to further reduce household sentiment (higher gas prices feel bad).
- Interest rates: The Federal Reserve has raised borrowing costs to their highest levels in decades to slow inflation. This is naturally restrictive for economic growth and has also created a very difficult environment for banks and home buyers.
Aspects of a Recession
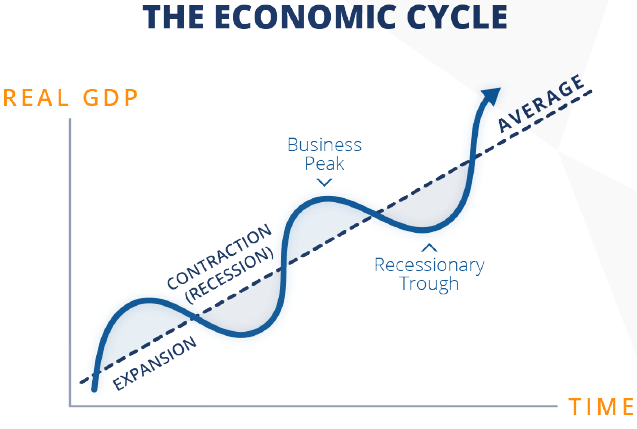
The National Bureau of Economic Research defines a recession as a significant decline in economic activity that is spread across the economy and lasts more than a few months. The problem with recessions is that they are typically identified by groups like NBER after they begin, and their depth and duration tend to be less predictable once a recession creeps into the psyche of households and businesses.
Example of the negative psychological snowball that can form around a recession:
- Rumblings of recession begin to be discussed in the media,
- Individuals and businesses begin to slow down purchases for fear that incomes may be affected,
- Slowing down of purchases causes someone else’s income to be affected,
- Effected entities further slowdown purchases and maybe begin to cut staff and other expenses,
- People fear for their jobs, stock market is likely volatile and declining, psychology changes,
- The negative cycle repeats until a bottom is found naturally or through government intervention.
Does a recession mean that mean all stocks will go down? Not necessarily.
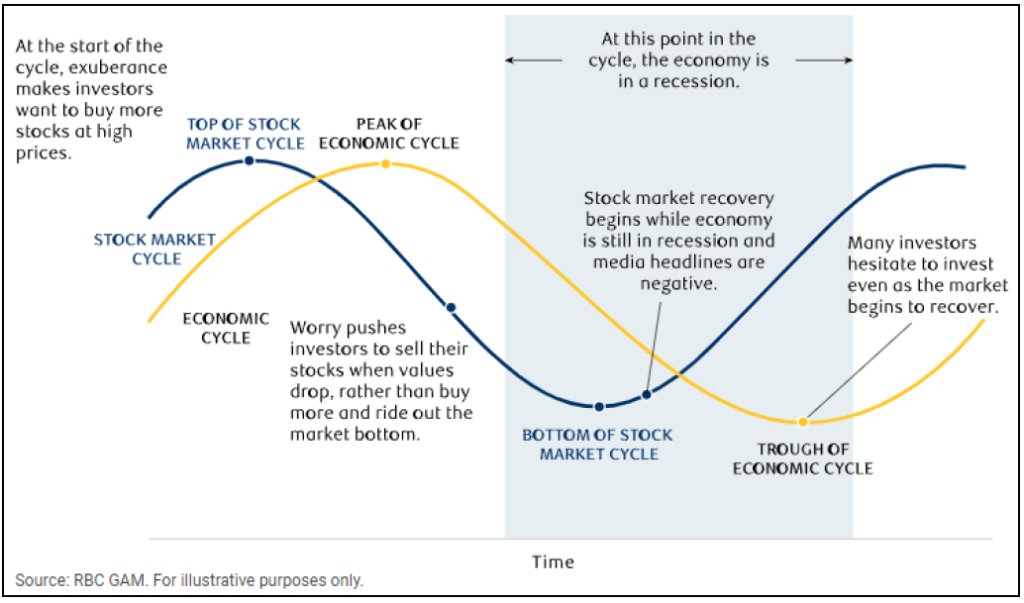
The stock market and the economy are not the same thing. Historically, we often observe that the market bottoms before or near the beginning of a recession. This makes sense given that stocks are priced based on investors’ collective expectations for the future cash flows generated by these businesses. In other words, investors sell their stocks when the data begins to look bleak, as opposed to waiting for the recession to occur. This is why we believe that there is the potential for greater market volatility in the coming quarters as investors refocus on the potential for a mild recession in 2024.
Could the Economy Surprise to the Upside?
Betting against the US economy is not an action to take lightly. In the long run, innovation and ingenuity will almost certainly lead to higher standards of living and greater economic growth. There have been only three recessions in the last thirty years, despite someone calling for a recession in the near term almost every time you turn on the financial
news. This is why we never advocate for completely moving out of markets as part of a long-term financial plan. Instead, we believe in “leaning into” and “leaning out of” riskier and more defensive investment types based on our outlook for the economy and the perceived value of those investments.
Much of the slowdown thesis hinges on the Federal Reserve maintaining a restrictive monetary policy, which has been their expressed intention for the foreseeable future. However, softening economic data may provide the Fed cover to reduce interest rates and the potential for a broader stock market rally if a significant recession is avoided (note we do not expect a significant recession in 2024).
How Should Investors Respond to Recession Risk?
There is a saying that “time in the market” is much more valuable in achieving long-term results than attempting to “time the market”. Staying invested, diversified, and seeking long-term opportunities is what matters most. If we witness an uptick in volatility, a focus on your long-term financial plan and goals, and waiting for opportunities because they are likely to present themselves later this year or early next year.
It’s also important to remember that over time the economy grows due to a number of factors including births, immigration, innovation, and productivity gains. Much focus this year has been about the advent of artificial intelligence tools like ChatGPT and their ability to drive efficiency gains across many parts of the economy. We are witnessing rapid advances in our healthcare portfolio that are curing diseases and extending lives. Even as our traditional measures of short-term economic growth tell us a mild contraction in the first half of 2024 is more likely, in the long run we believe this period will look like a mild speedbump.
Portfolio Positioning
The portfolios contain a very diversified mix of asset classes such as bonds, US stocks, real estate, commodities, infrastructure, and alternative investments. Some categories hold up well during slowing economic environments and can provide the portfolio with the dry powder to buy dislocated assets during periods of market volatility.
In addition, if the economy begins to show signs of slowing and the US Federal Reserve hints at lowering interest rates, it could be a positive catalyst for categories which have struggled this year in the face of interest rate hikes. If anything, the prospects for increased economic headwinds makes defensive categories that much more attractive. If market enthusiasm around the economy starts to waver the focus on large tech could give way to focusing on more undervalued parts of the market which could include value stocks, small cap stocks, and foreign stocks where we already have exposure.
Key Economic Data

Outlook & Positioning Summary

Economy
The US labor market has been a key pillar of strength that helped the US avoid recession in 2023 but is beginning to show signs of slowing.
Inflation has shown signs of slowing, but higher energy prices, labor strikes, and federal government infrastructure spending have the potential to keep price increases higher for longer, which may require the US Federal Reserve to keep interest rates higher for longer as well.
Valuation
The largest US companies led the market higher in 2023, but we believe that opportunities abound in dividend, small, and foreign stocks, as well as within fixed income which offers 4-6% yields today on relatively defensive securities.
Technical
The S&P 500 may have entered a new bull market, though many other asset classes are still attempting to find their footing (potential value opportunities).
Investor sentiment quickly flipped to “normal” levels after having been very pessimistic for much of the last 18 months.
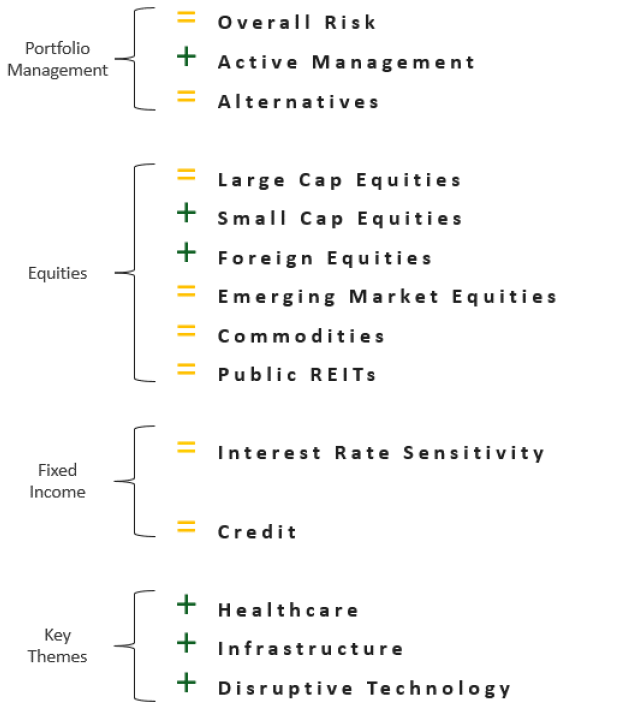
Positioning
Overall risk versus target is neutral as markets do not appear overly cheap or expensive and economy remains at risk of a mild recession in 2024.
Increasingly looking toward short-term high quality fixed income as well as dividend stocks which may provide defense, liquidity, income, and flexibility in a volatile market environment.
Should economic data begin to soften and the US Federal Reserve significantly lowers interest rates, assets such as bonds, dividend stocks, small US companies, infrastructure, and foreign companies all have the potential to perform well.
In the long-term, themes such as innovative healthcare, infrastructure, and technology have the potential to drive portfolio growth and outperform the broad market.
Prices & Interest Rates
| Representative Index | September 13, 2023 | Year-End 2022 |
|---|---|---|
| Crude Oil (US WTI) | $87.30 | $80.26 |
| Gold | $1,927.80 | $1,819 |
| US Dollar | 104.74 | 103.52 |
| 2 Year Treasury | 4.97% | 4.41% |
| 10 Year Treasury | 4.29% | 3.88% |
| 30 Year Treasury | 4.34% | 3.97% |
Asset Class Returns
| Category | Representative Index | YTD | 2022 | 1 Year | 3 Years | 5 Years |
|---|---|---|---|---|---|---|
| US Large Cap Equity | S&P 500 | 17.7% | -18.1% | 15.5% | 11.9% | 10.9% |
| US Large Cap Equity | Dow Jones Industrial Average | 6.0% | -6.9% | 13.6% | 9.9% | 8.1% |
| US All Cap Equity | Russell 3000 Growth | 29.5% | -29.0% | 20.8% | 10.2% | 12.8% |
| US All Cap Equity | Russell 3000 Value | 4.9% | -8.0% | 7.1% | 12.1% | 6.6% |
| US Small Cap Equity | Russel 2000 | 5.6% | -20.4% | 2.1% | 8.5% | 2.8% |
| Global Equity | MSCI All-Country World | 13.8% | -18.4% | 13.3% | 8.1% | 7.5% |
| Global Equity | MSCI All-Country World ESG Leaders | 14.9% | -20.0% | 15.2% | 8.0% | 8.0% |
| Foreign Developed Equity | MSCI EAFE | 9.4% | -14.5% | 16.3% | 5.8% | 4.2% |
| Emerging Market Equity | MSCI Emerging Markets | 4.0% | -20.1% | 2.1% | -1.3% | 1.6% |
| US Fixed Income | Bloomberg Barclays US Agg. Bond | 0.7% | -13.0% | -0.4% | -4.7% | 0.4% |
| US Fixed Income | Bloomberg Barclays Municipal Bond | 1.3% | -8.5% | 2.7% | -1.4% | 1.6% |
| Global Fixed Income | Bloomberg Barclays Global Agg. Bond | -0.4% | -16.3% | 0.4% | -6.4% | -1.4% |
References
- 1Source: YCharts as of 09/13/2023. The ETFs presented above are not intended to be benchmarks for performance. Rather, they are intended to be demonstrative of a particular sector or segment the investment universe discussed. Each ETF was selected as opposed to an index to more accurately reflect what an investor might experience. There are other ETFs or indices that might be representative of the same spaces. However, we believe the ones shown are sufficiently representative to assist us in explaining our investment thesis.
- 2Bureau of Labor Statistics
- 3Source: YCharts as of 09/13/2023. The ETFs presented above are not intended to be benchmarks for performance. Rather, they are intended to be demonstrative of a particular sector or segment the investment universe discussed. Each ETF was selected as opposed to an index to more accurately reflect what an investor might experience. There are other ETFs or indices that might be representative of the same spaces. However, we believe the ones shown are sufficiently representative to assist us in explaining our investment thesis.
- 4