
Executive Summary
A handful of large US technology companies have driven the market higher this year while the return for the average company is relatively flat.
Growth of the US economy and corporate earnings appears to have flat-lined, and investors are now seeking to determine the future direction of both.
We do not anticipate a significant US economic / earnings contraction, driven largely by the robust labor market, but stress in the US banking system and resulting tighter lending conditions seem almost certain to be a meaningful headwind for the rest of 2023.
The debt ceiling may be an additional source of volatility, but history has shown a propensity for this risk to be resolved.
One Chart You Need: Corporate Earnings
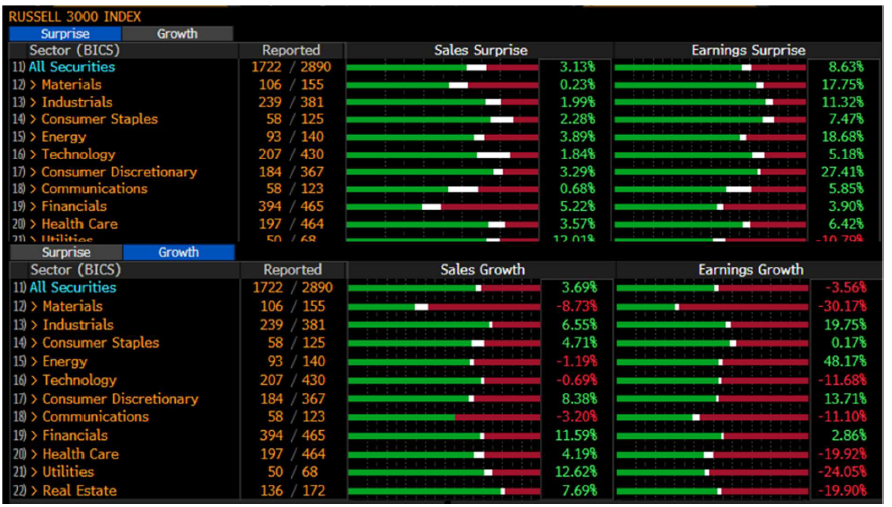
The Russell 3000 Index is often cited as providing comprehensive exposure to public US companies. Within that index, 1,788 companies have reported results for the first quarter of 2023. Of those, 1,119 (65%) have outperformed expectations with an average “beat” of 9% (results were 9% higher than expected by Wall Street analysts). Earnings growth versus Q1 2022 was down modestly (-4%). What does this all mean and why is it important? Stocks trade based on their expected future cash flows, so better-than-expected earnings help to justify a higher share price. This may be particularly important today given that markets have been teetering on the brink of declining earnings.

Large technology companies are leading the way yet again. After a break during 2022 in the nearly decade-long wave of outperformance by large-cap growth stocks, these companies are once again market leaders. Companies with large weightings in the NASDAQ Composite Index like Microsoft and Apple have advanced approximately 30% each this year. Meta Platforms (Facebook) and Nvidia have returned 90% and 100%, respectively. These names have helped to lift the S&P 500 as well, albeit to a lesser degree. The average stock in the S&P 500 index has gained just 3%1As measured by the total return of the Invesco S&P 500 Equal Weight ETF and smaller US companies gaining less than 1% as a group.2As measured by the total return of the Russell 2000 Index
A confluence of forces may be benefiting this narrow part of the market. For example, investors may be perceiving Apple and Microsoft as areas of quality and safety with durable earnings in an uncertain economic environment. Additionally, the fervor around artificial intelligence (AI) and tools like ChatGPT, which have the potential to drive efficiencies in innumerable ways, has also benefitted Microsoft, which has a 49% stake in ChapGPT-maker, OpenAI, and Nvidia which is a leader in designing AI-focused semiconductors (computer chips).
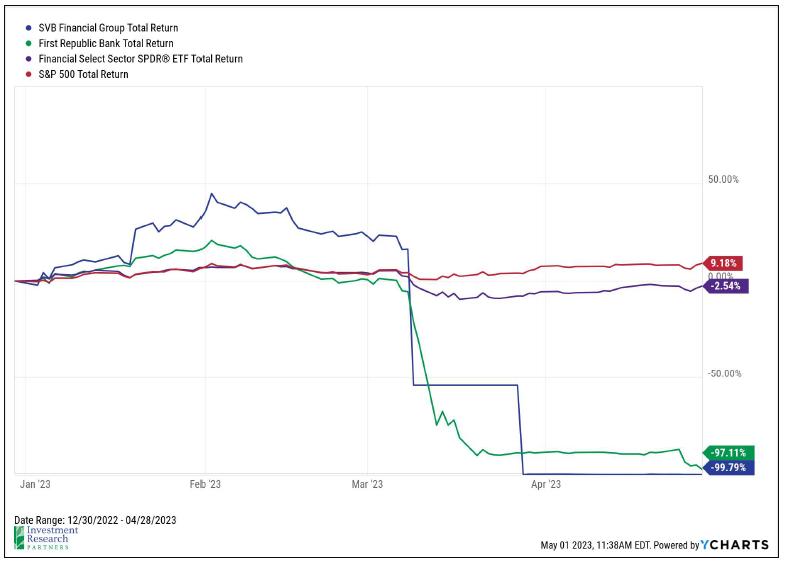
At the other end of the performance spectrum, you have the banking industry, which has been rocked by high-profile failures this year. Early May saw the seizure of First Republic Bank by state regulators following a similar fate for Silicon Valley Bank less than two months prior. The Federal Deposit Insurance Corporation (FDIC) was appointed as receiver and the deposits, loans, and securities held by the bank were ultimately won by JPMorgan as part of a bidding process. First Republic Bank was the second largest bank to fail in US history after losing approximately $100 billion in deposits in just a few weeks (the largest failure was that of Washington Mutual Bank during the 2008 financial crisis).3https://www.wsj.com/articles/first-republic-bank-is-seized-sold-to-jpmorgan-in-second-largest-u-s-bank-failure-5cec723 The speed at which these bank runs occurred may have caught regulators by surprise, and as of early May, the FDIC has begun the process of proposing that Congress consider increasing the insured deposit limit threshold above $250,000 in some or all circumstances as an attempt to avoid similar issues in the future.4https://finance.yahoo.com/news/fdic-proposes-congress-increase-deposit-insurance-limits-for-payroll-accounts-181123469.html
Fed Meeting Recap: End of Tightening Cycle?
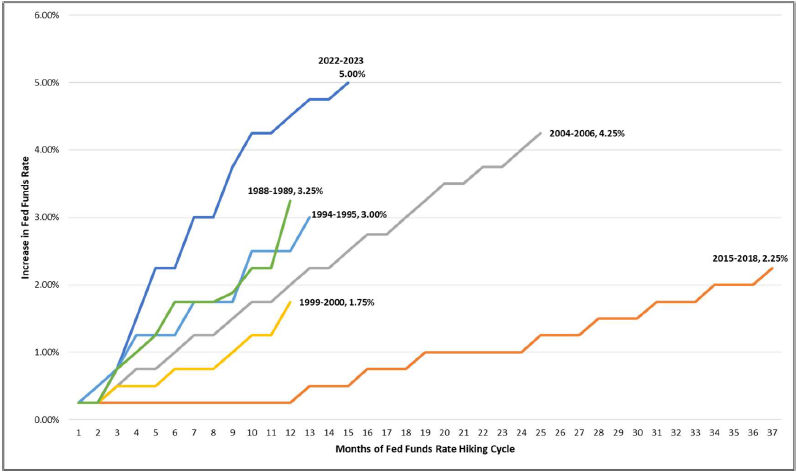
We may have seen the final rate hike from the Federal Reserve in a tightening cycle resulting in an interest rate increase of 5% in just over a year, a pace not seen in more than four decades. The Fed notably softened the language in its most recent policy statement to reflect additional economic uncertainty stemming from the banking sector stress that began in early March, the effects of which on credit tightening are not yet known. Additionally, in signaling the potential future path of interest rates, the statement from the March Fed meeting stated, “The Committee anticipates that some additional policy firming may be appropriate…” The most recent statement seemed to leave the door open for a pause in rate increases, explaining the Committee would need to determine “the extent to which additional policy firming may be appropriate…”

Chairman Powell was balanced in his press conference as always, reiterating that no decision has been made for future meetings and the Committee would continue to watch incoming economic data for signs of inflation coming down towards its 2% target (noting that we still have a long way to go to get there, and that the job market remains exceptionally strong in the face of all the monetary tightening thus far). He also pushed back on the market’s expectations of rate cuts beginning later this year. When pressed during the Q&A, he explained the Committee is forecasting inflation to come down, but not for some time, and “if that forecast is correct, it will not be appropriate to cut rates.” We believe this discrepancy between market expectations for rate cuts and Fed forecasts of “higher for longer” could be a cause of volatility in the rates market in the coming months.
Earnings
As of early May, we are now mostly through earnings season. Approximately 420 of the companies in the S&P 500 index have reported first-quarter 2023 results. Of those, 78% have outperformed consensus earnings expectations at the start of the quarter by approximately 7%, on average. However, despite these positive surprises, S&P 500 earnings are still expected to decline 2% from the first quarter 2022 level.
When looking at smaller companies that may be considered more sensitive to the economic cycle, earnings surprises have been largely positive there as well, as has year-over-year earnings growth. Roughly 55% of the companies in the Russell 2000 index (a commonly cited benchmark for small US companies) have reported first-quarter results with 59% of those outperforming expectations by approximately 6%, on average. Earnings for the companies that have reported first-quarter results is 8% lower than Q1 2022, on average.

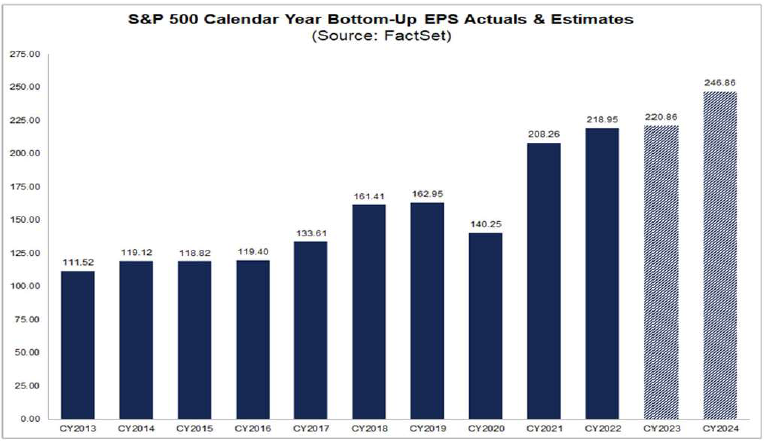
Within the S&P 500, the consumer discretionary sector was particularly strong with earnings 28% higher than expected resulting in 31% year-over-year earnings growth. This is both encouraging and important because US households drive approximately two-thirds of gross domestic product (economic activity), so the robust outperformance by this sector may be providing confirmation that a significant recession is off the table for now. Also, important and encouraging is the fact that analysts have been finally revising up their expectations for 2023 S&P 500 earnings in April following more than a year of downward revisions to aggregate expectations. Markets may view this inflection point as further confirmation that the bear market may have ended.
Looking forward, analysts are expecting just 1% earnings growth in 2023 followed by 12% growth in 2024 for the S&P 500 index, which would imply a price today of 17x 2024 expected earnings.
Economy
The US economy absolutely appears to be slowing, and it seems as though investors are searching for indications as to the potential depth of an impending recession. Prior to the banking crisis, which began in March, it seemed to us very possible that the US may exit this period of inflation and tighter monetary policy without a contraction in gross domestic product (a recession). Tighter lending standards nationally are almost certain to lead to a contraction, but the data so far has been mixed. For example, the Conference Board offers its index of Leading Economic Indicators which includes data points related to manufacturing activity, homebuilding, household sentiment, financial conditions, and the S&P 500 index itself (yes, stocks are actually one of the better leading indicators). In April, nearly all of the indicators contracted, and the Conference Board is forecasting a recession beginning around the middle of this year.
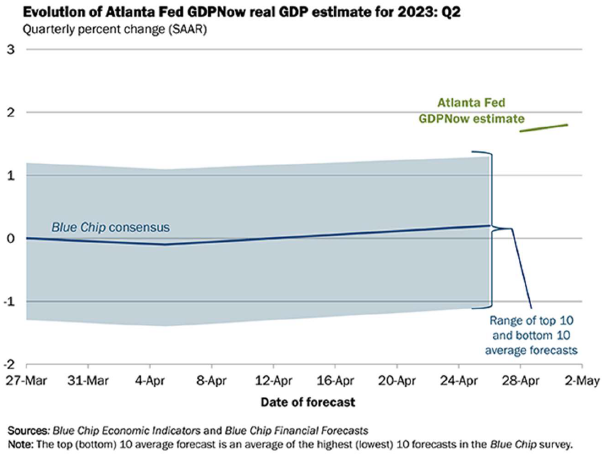
Conversely, the Atlanta branch of the US Federal Reserve offers its “GDPNow” tool which similarly attempts to predict future economic activity based on current data. The tool has been consistently (and correctly) more optimistic than consensus expectations over the last year and continues to predict modest economic growth into at least the second quarter.
The most recent US employment report showed continued strength in the labor market. The total number of employed Americans reached another all-time high of 155.6 million as 200,000 net new jobs were added. The unemployment rate continues to hover near a 50-year low at 3.5%.5Bureau of Labor Statistics as of May 5, 2023 We expect that the durability of the employment market should provide resiliency in household spending and help to prevent a significant recession.
Debt Ceiling
The US federal government typically spends more money than it receives, necessitating the need to borrow in order to fund the resulting deficit. The most common form of federal government borrowing is the issuance of US Treasury securities; the promise by Uncle Sam to pay principal and interest at a future date in exchange for investor dollars today. New borrowing is added to the national debt, which is now nearing the “debt ceiling”; a limit imposed by Congress on how much the Treasury can borrow. The debt ceiling has been modified 102 times since World War II6Congressional Research Service, though the procedure of Congress allowing the Treasury to issue more debt to fund already-congressionally-approved spending has become increasingly hostile and partisan over the last 10-15 years.
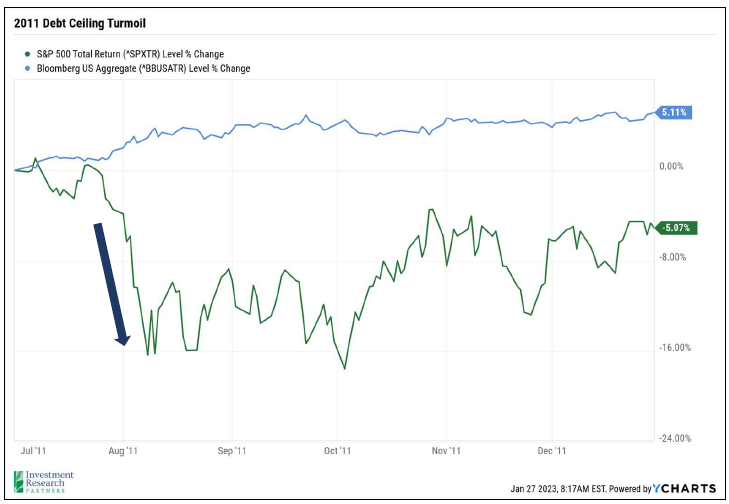
If the US Treasury is unable to issue new debt to pay its bills, it will default, at least temporarily, on many of its obligations. While it is difficult to handicap whether the US will technically default this summer, we anticipate that the event would stress global markets should it occur. The most recent analog to our current situation played out in the summer of 2011 when the highly politicized debate brought the government within hours of technically defaulting on its debt. While a last-minute agreement was reached after tense negotiations, the prolonged fight resulted in Standard & Poor’s downgrading the federal government’s debt, a move that rattled global risk assets. The S&P 500 index subsequently fell more than 17 percent before rallying back somewhat toward the end of the year. Counterintuitively, US Treasury bonds, which were downgraded because of the event, continued to act as a safe haven for investors concerned about volatility.7Source: 2011 United States debt-ceiling crisis – Wikipedia
Treasury Secretary, Janet Yellen, recently forecasted that the US government could become unable to pay all of its bills as soon as June 1st if the debt limit is not raised. In response to the new and abbreviated timeline, President Biden invited leaders from both major political parties to the White House for talks on May 9th. Not raising the debt ceiling would risk a loss of confidence in the US’s ability and willingness to repay its debts, and thus investors would likely require higher interest rates on future borrowing for compensate them for the increased risk. These higher rates would also likely impact rates for other forms of debt such as mortgages and business loans. If the debt ceiling is not raised, it is expected that the Treasury will continue to pay its debt obligations, but payments to agencies, contractors, and beneficiaries of social security and Medicare may need to be delayed.8Brookings Institute: How worried should we be if the debt ceiling isn’t lifted?
Outlook & Positioning Summary
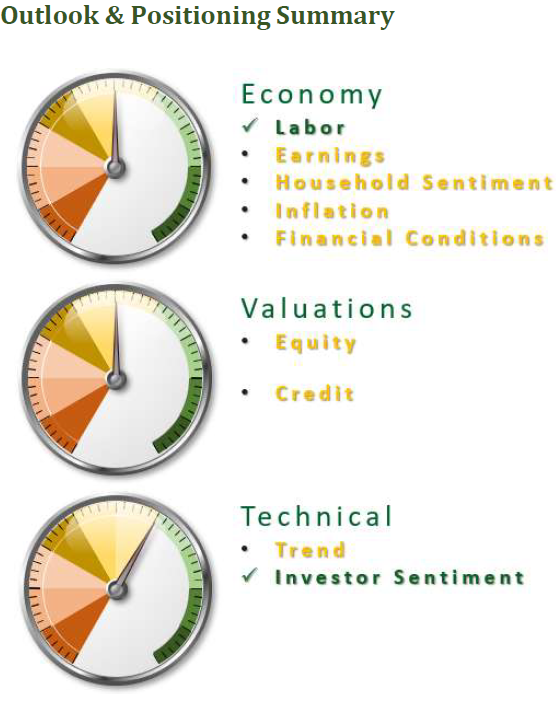
Economy
The US labor market has been a key pillar of strength that is likely supporting household confidence in spending as well.
Inflation has begun to show signs of softening (notably home and energy prices) which may lead to a Fed pause in the near future.
Valuation
Stocks and bonds, on average, appear fairly valued today, but beneath the surface there may be many pockets of opportunity created by violent upheaval in markets during 2022.
Technical
Stocks have attempted to re-enter a long-term uptrend multiple times since mid-2022, but none have yet proven sustainable, at least not for large cap US stocks.
Investors turned fairly bearish in March, which may present a contrarian buying opportunity.
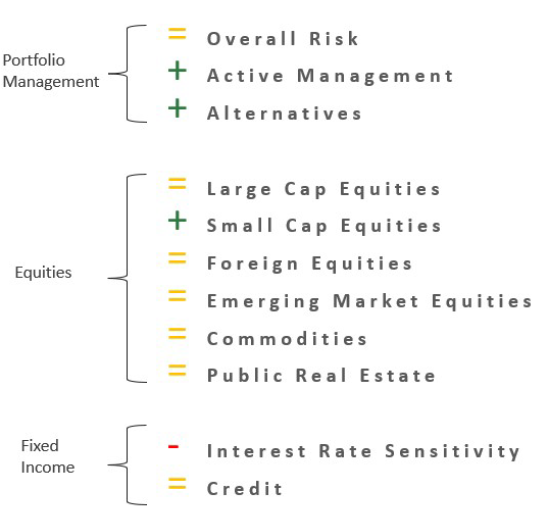
Positioning
Overall risk versus target is neutral as markets do not appear overly cheap or expensive and economy may be entering a “muddle through” period.
Favor active management and flexible alternative strategies as market volatility may have created pockets of opportunity beneath the surface.
Overweight US small cap stocks as valuations appear attractive.
Remain cautious on interest rate sensitive investments while Fed continues to increase interest rates, but actively working now to reduce past underweight that benefitted portfolios in 2022.
Prices & Interest Rates
| Representative Index | April 2023 | Year-End 2022 |
|---|---|---|
| Crude Oil (US WTI) | $76.78 | $80.26 |
| Gold | $1,990 | $1,819 |
| US Dollar | 101.66 | 103.52 |
| 2 Year Treasury | 4.04% | 4.41% |
| 10 Year Treasury | 3.44% | 3.88% |
| 30 Year Treasury | 3.67% | 3.97% |
Asset Class Returns
| Category | Representative Index | 1 Month | YTD | 1 Year | 3 Years | 5 Years |
|---|---|---|---|---|---|---|
| US Large Cap Equity | S&P 500 | 1.6% | 9.2% | 2.7% | 14.6% | 11.5% |
| US Large Cap Equity | Dow Jones Industrial Average | 2.6% | 3.5% | 5.6% | 14.2% | 9.5% |
| US All Cap Equity | Russell 3000 Growth | 0.9% | 14.8% | 2.3% | 13.3% | 13.1% |
| US All Cap Equity | Russell 3000 Value | 1.3% | 2.2% | 0.7% | 14.5% | 7.5% |
| US Small Cap Equity | Russel 2000 | -1.8% | 0.9% | -3.7% | 11.9% | 4.2% |
| Global Equity | MSCI All-Country World | 1.4% | 8.9% | 2.1% | 12.1% | 7.0% |
| Global Equity | MSCI All-Country World ESG Leaders | 1.2% | 9.1% | 1.2% | 11.6% | 7.3% |
| Foreign Developed Equity | MSCI EAFE | 2.8% | 11.5% | 8.4% | 11.7% | 3.6% |
| Emerging Market Equity | MSCI Emerging Markets | -1.1% | 2.8% | -6.5% | 4.3% | -1.1% |
| US Fixed Income | Bloomberg Barclays US Agg. Bond | 0.6% | 3.6% | -0.4% | -3.2% | 1.2% |
| US Fixed Income | Bloomberg Barclays Municipal Bond | -0.2% | 2.5% | 2.9% | 2.9% | 2.1% |
| Global Fixed Income | Bloomberg Barclays Global Agg. Bond | 0.4% | 3.5% | -2.3% | -2.3% | -0.9% |
References
- 1As measured by the total return of the Invesco S&P 500 Equal Weight ETF
- 2As measured by the total return of the Russell 2000 Index
- 3
- 4
- 5Bureau of Labor Statistics as of May 5, 2023
- 6Congressional Research Service
- 7Source: 2011 United States debt-ceiling crisis – Wikipedia
- 8Brookings Institute: How worried should we be if the debt ceiling isn’t lifted?