
Executive Summary
In February, markets gave back some of their January gains as consensus expectations for interest rates moved higher. In other words, the US Federal Reserve may have more work to do than previously thought in order to tame inflation. This is generally bad news for borrowers (higher interest cost) and good news for savers (more interest received). We do not expect a nasty recession and the data continues to support that. This month, we highlight services and manufacturing purchasing managers index (PMI) reports, which showed services in continued expansionary territory and manufacturing attempting to bottom. So far, the great Paul Samuelson quip lives on: “The stock market has predicted nine of the last five recessions.
One Chart You Need: US Services & Manufacturing
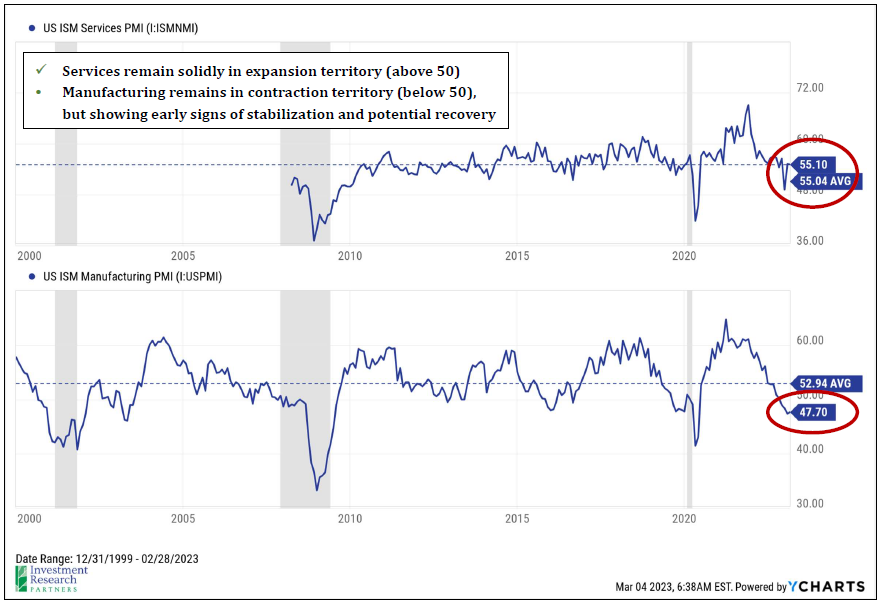

The stock market is not the economy, but rather the stock market attempts to anticipate the future direction of the economy and the expected cash flows of the companies that comprise it. Predicting short-term stock market moves or “calling the bottom” is exceedingly difficult, but if one endeavors down this exceedingly difficult path, they should start with the illustration at left. Of course, there will always be surprises that cannot be predicted, like global pandemics, and there will always be geopolitical risks on the horizon. This is why we recommend and practice a more gradual “leaning in / leaning out” approach to investing whereby we lean into perceived opportunities over time when their current prices and future prospects appear attractive. Today, across many asset classes, we are leaning in.
As inflation has begun to show signs of moderating, the spirits of US households have been recovering as well. For more than 60 years, the University of Michigan has been conducting a survey of household sentiment. In its current form, several hundred households across the country are asked each month a series of questions seeking to gauge the general consensus on how US citizens feel about their own financial condition and the condition of the economy both currently and in the future. Monthly results for the last 50 years are below, and February’s reading was well below average, implying that households feel worse than usual. However, remembering that the stock market is not the economy, we have found that bottoms in household sentiment, which we experienced last summer, often coincide with above-average future stock market returns. In other words, the data just has to begin trending in the right direction for the stock market (an anticipatory mechanism) to begin recovering as well. Since sentiment bottomed last June, the S&P 500 index has returned more than 8 percent through early March 2023.1 ”


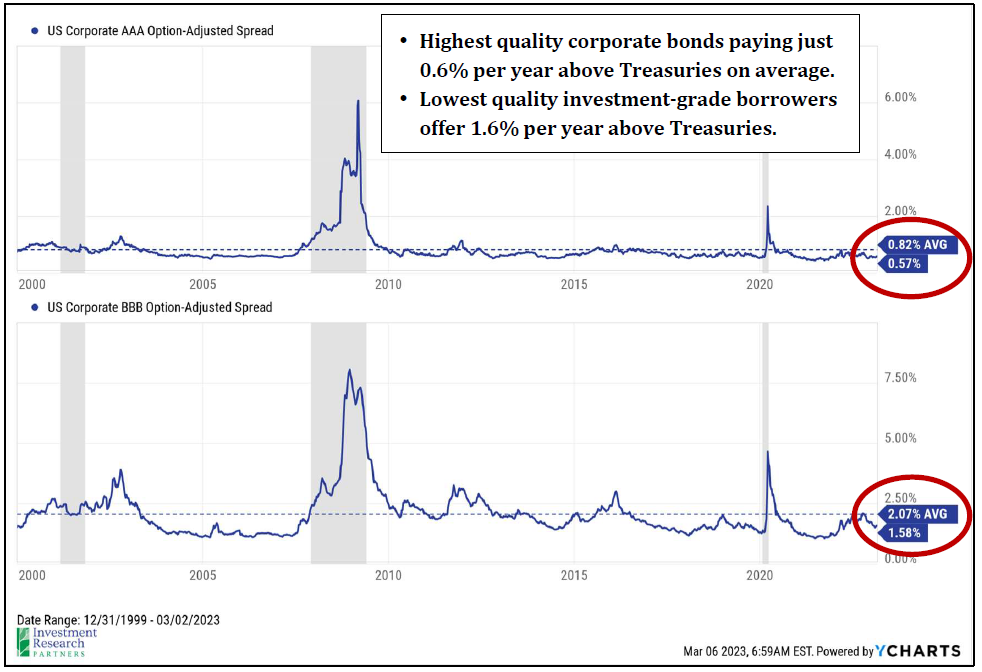
What’s different today than most of the last 15 years is that investors are actually able to earn a decent yield. US Treasury securities now offer 4-5%, and many dividend focused stock portfolios yield 3- 4% in addition for their potential to grow dividends and value over time.2 For a portfolio holding income-producing securities, this helps to reduce volatility and offers an element of getting paid to wait for future stock market gains. We are beginning to lean back into traditional bonds, with an emphasis on shorter-maturity higher quality securities. It is possible that the Federal Reserve may need to continue along their path of raising interest rates in order to control inflation longer than we expect, which could further pressure bond prices. Additionally, credit spreads, or the amount of additional compensation a bondholder receives for lending to a risky borrower, are near- or below-average across many parts of the fixed income market. Meaning, there may not be sufficient additional yield to justify leaving the safety of Treasuries, particularly for longer maturities.
Many parts of the market offer more value than 18 months ago, and we continue to selectively seek areas of value to which to lean in.
2 Chart Source: JPMorgan Guide to the Markets. Municipal bonds shown as tax-equivalent yield for top-income tax bracket investor.
Outlook & Positioning Summary

Economy
The US labor market has been a key pillar of strength that is likely supporting household confidence in spending as well.
Inflation has begun to show signs of softening (notably home and energy prices), which has led to increasing household sentiment
Valuation
Stocks and bonds, on average, appear fairly valued today, but beneath the surface there may be many pockets of opportunity created by violent upheaval in markets during 2022.
Technical
Stocks have attempted to re-enter a long-term uptrend multiple times since mid-2022, but none have yet proven sustainable, at least not for large cap US stocks.
Investors turned fairly bearish in February, which may present a contrarian buying opportunity.
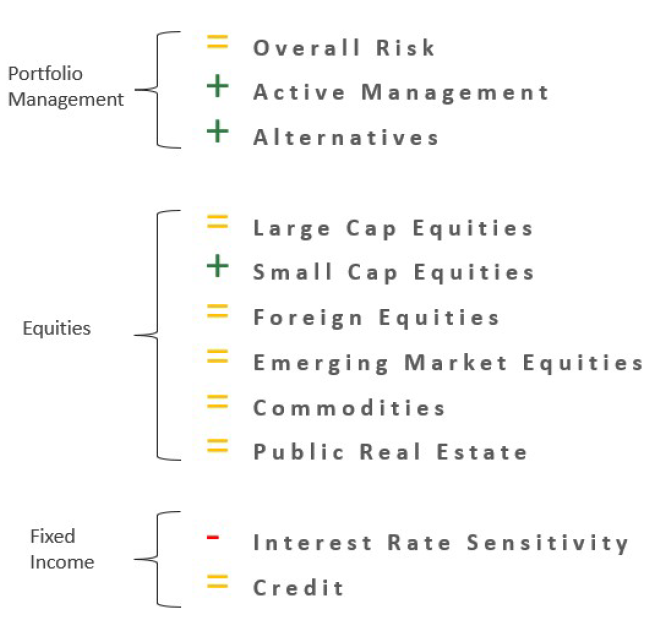
Positioning
Overall risk versus targets neutral as markets do not appear overly cheap or expensive and economy may be entering a “muddle through” period.
Favor active management and flexible alternative strategies as market volatility may have created pockets of opportunity beneath the surface.
Overweight US small cap stocks as recession fears may be overblown.
Remain cautious on interest rate sensitive investments while Fed continues to increase interest rates, but actively working now to reduce past underweight that has benefitted portfolios in 2022.
Prices & Interest Rates
| Representative Index | Feb 2023 | Year-End 2022 |
|---|---|---|
| Crude Oil (US WTI) | $77.05 | $80.26 |
| Gold | $1,829 | $1,819 |
| US Dollar | 104.87 | 103.52 |
| 2 Year Treasury | 4.81% | 4.41% |
| 10 Year Treasury | 3.92% | 3.88% |
| 30 Year Treasury | 3.93% | 3.97% |
Asset Class Returns
| Category | Representative Index | Feb 2023 | YTD 2023 | 1 Year | 3 Years | 5 Years |
|---|---|---|---|---|---|---|
| US Large Cap Equity | S&P 500 | -2.4% | 3.7% | -7.7% | 12.1% | 9.8% |
| US Large Cap Equity | Dow Jones Industrial Average | -3.9% | -1.1% | -1.6% | 11.0% | 7.8% |
| US All Cap Equity | Russell 3000 Growth | -1.2% | 7.2% | -13.0% | 11.7% | 11.1% |
| US All Cap Equity | Russell 3000 Value | -3.5% | 1.8% | -2.9% | 11.1% | 7.2% |
| US Small Cap Equity | Russel 2000 | -1.7% | 7.9% | -6.0% | 10.1% | 6.0% |
| Global Equity | MSCI All-Country World | -2.9% | 4.1% | -8.3% | 8.8% | 5.8% |
| Global Equity | MSCI All-Country World ESG Leaders | -3.0% | 4.2% | -8.9% | 8.3% | 6.1% |
| Foreign Developed Equity | MSCI EAFE | -2.1% | 5.8% | -3.1% | 6.8% | 2.6% |
| Emerging Market Equity | MSCI Emerging Markets | -6.5% | 0.9% | -15.3% | 1.0% | -1.9% |
| US Fixed Income | Bloomberg Barclays US Agg. Bond | -2.6% | 0.4% | -9.7% | -3.8% | 0.5% |
| US Fixed Income | Bloomberg Barclays Municipal Bond | -2.3% | 0.6% | -5.1% | -1.6% | 1.7% |
| Global Fixed Income | Bloomberg Barclays Global Agg. Bond | -3.3% | -0.2% | -13.6% | -5.1% | -1.7% |