
Executive Summary
A handful of large US technology companies have driven the market higher this year while the return for the average company is relatively flat.
Growth of the US economy and corporate earnings appears to have flat-lined, and investors are now seeking to determine the future direction of both.
We do not anticipate a significant US economic / earnings contraction, driven largely by the robust labor market and resilient US households.
The economy seems to be able to stand on its own, despite higher interest rates, which may present opportunities as investors, on average, remain bearish and focused on the potential for a significant recession.
One Chart You Need: Big Tech Driving the Market Yet Again
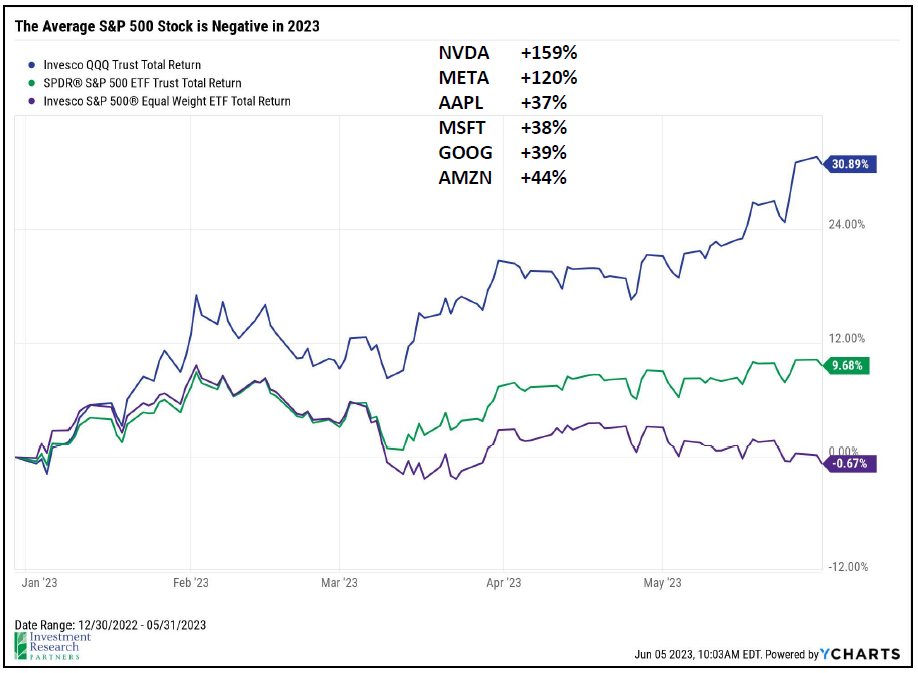
Enthusiasm for artificial intelligence, amongst other factors, seems to be driving large technology companies significantly higher in 2023. Nvidia, for example, which is a leading producer of semiconductors (computer chips) that allow for AI computing has soared 159% through May. Double-digit gains from large companies like Apple, Microsoft, Alphabet (Google), Amazon, and Meta Platforms (Facebook) have powered the S&P 500 index higher by 10% this year. That’s great, except no one has yet told the other ~495 companies that a new bull market is attempting to take shape. The average return for the S&P 500’s constituents is actually negative by 0.7%. This dynamic has presented a significant challenge for active managers seeking to outperform the market when nearly all of the market’s gains have come from just a few companies. In the rest of this month’s outlook, we will dive into what it might take for the rest of the market to join in the rally.
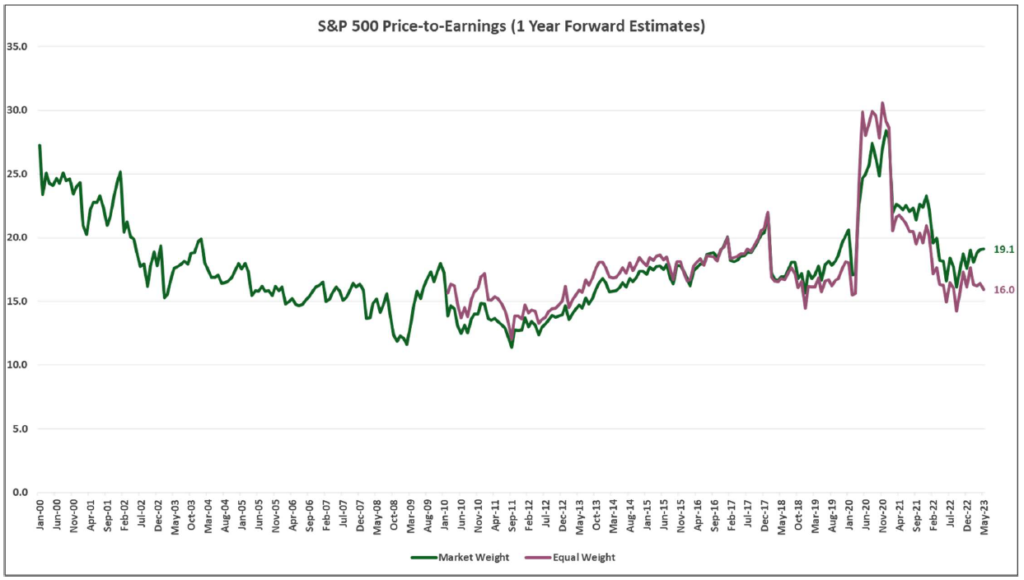
The rally in large tech stocks may be distorting the perception of the market’s remaining value. For example, the S&P 500 trades at 19x expected earnings over the next year, but that number drops to 16x when looking at the equally-weighted S&P 500 index. In other words, the average stock trades nearly 20% less expensive than the index which is biased by large tech companies.
Economy
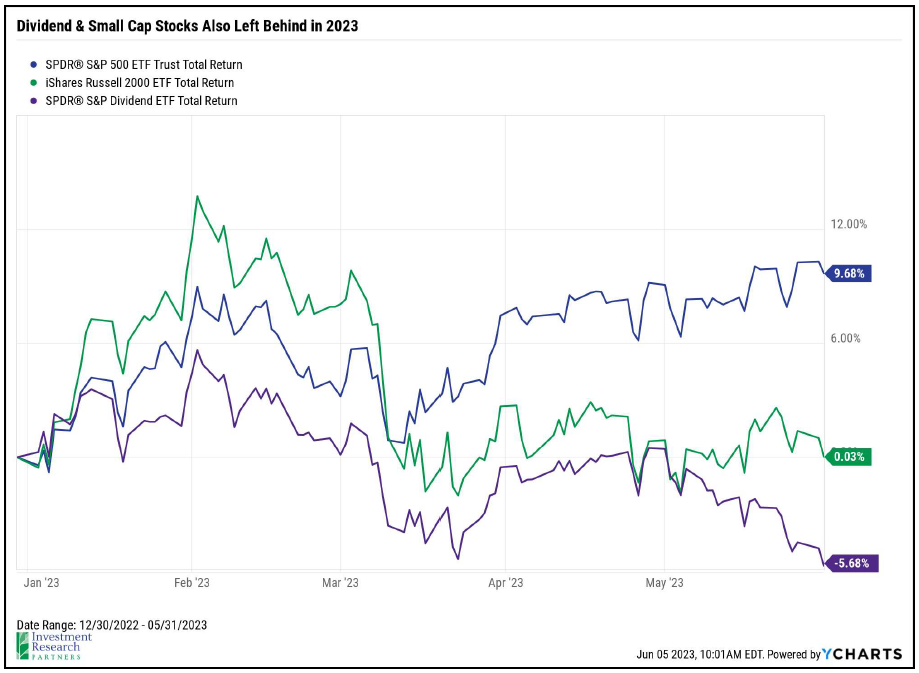
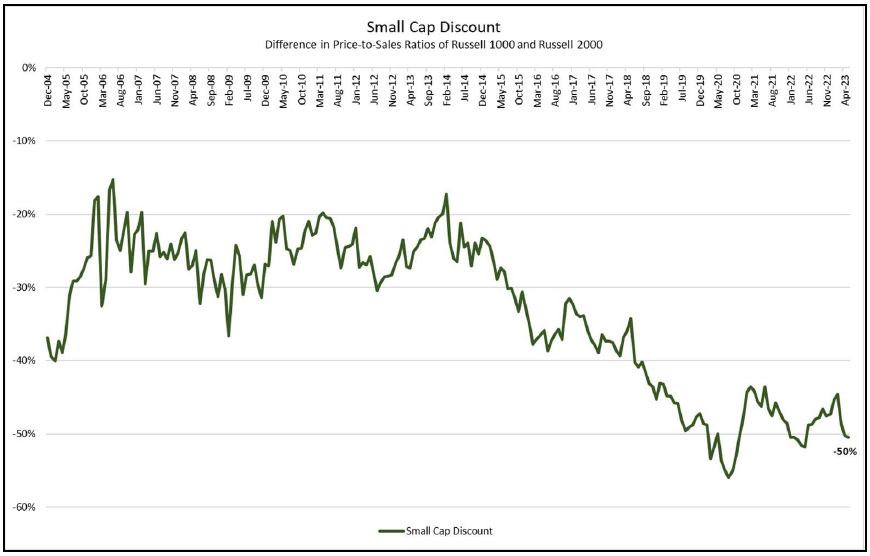
It is clear that economic growth has slowed as a result of higher interest rates imposed by the US Federal Reserve. It was their goal to throw water on the fire of an economy that was showing signs of overheating. As the economy and inflation cool, investors are now focused on determining if the fire will go out altogether and we will enter a recession. We don’t see it, at least not a meaningful recession in 2023. The jobs market is too strong, household financial conditions are, on average, still too healthy, and it appears as though the Federal Reserve may be nearing the end of its interest rate hiking cycle. This is not to say that we’re expecting gangbusters economic growth over the next year either. When looking for investment opportunities, we believe there are many attractively priced parts of the market today, particularly those that seem to be priced for a significant recession, which we do not expect. For example, small-cap US stocks today trade for roughly half the price-to-sales ratio of their large-cap peers. The decision to own this part of the market has many additional considerations, but the near historically wide discount certainly gets our attention.

More than 300,000 new jobs were added to the US economy in May, resulting in yet another record number of employed Americans (we’ve had 11 in a row since last July). And the unemployment rate stands near a 50-year low at 3.7%. What doesn’t get as much press is the enormous number of job openings that remain unfilled. Despite all of the concerns of an impending recession, employers still have more than 10 million job openings, which is nearly two available jobs for every person seeking one. Recessions don’t typically happen in a labor market this robust. However, it is certainly a labor market that is running out of capacity to grow, and such strong demand for labor will likely continue to create inflationary pressures in the form of higher wages. Higher wages are a good thing for sure, but they don’t necessarily make the Federal Reserve’s job of dampening inflation any easier.

As the economy continues to show resilience in the face of higher interest rates, it would not be surprising to see the Fed keep interest rates higher for longer in order to ensure that inflation is under control and to provide more ability to be accommodative for the next eventual downturn. The market now expects the Fed to keep interest rates near 5% at least into early 2024. This is a sharp increase from just a few months ago following the collapse of Silicon Valley Bank when investors were expecting the Fed to need to begin reducing interest rates in the second half of 2023 toward 3-4% in early 2024.
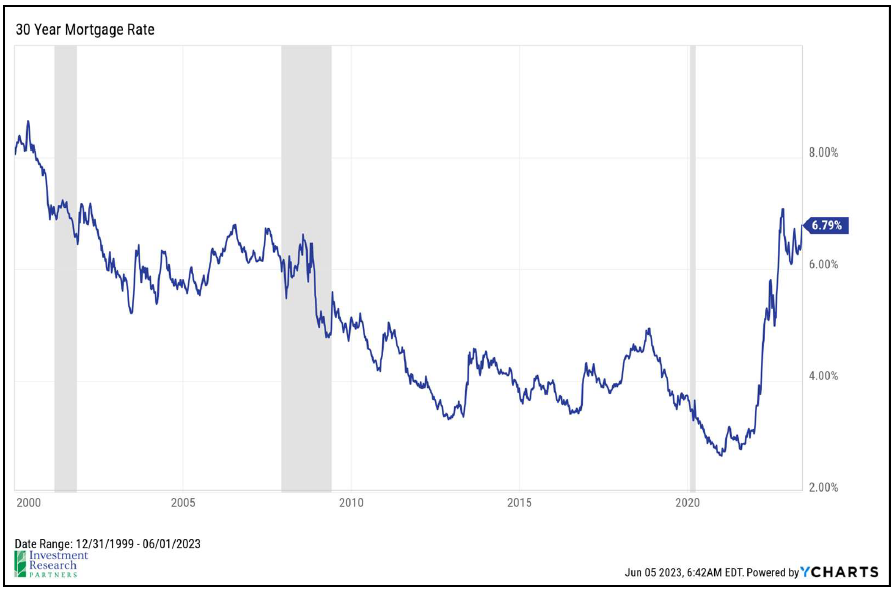
You might say, that doesn’t sound like a big difference: interest rates of 3-4% vs. 5%. But the Fed Funds rate flows through the pricing of so many other parts of the economy and markets. From an economic perspective, the rate impacts the borrowing costs for households and businesses. A 1% difference in the mortgage rate for the purchase of a $400,000 home ($320,000 mortgage) is $2,400 per year, which is real money for the average family and impacts the size of the home they may be able to afford. From a market perspective, higher interest can make other investments look less attractive by comparison, causing their prices to decline. For example, let’s assume that a corporate bond pays 5% interest. Two years ago when the Fed Funds rate was zero, that bond might look attractive, but now that a short term CD or US Treasury bill pays the same or higher, not so much. Of course, there are lots of other considerations here, but you get the idea.

To be clear, it is a good thing that the economy can withstand 5% interest rates. For much of the last 15 years, rates have been near zero following the 2008 financial crisis and the 2020 global pandemic. In these instances, the economy had become so fragile (at least from the Fed’s perspective) that ultra accommodative monetary policy steps were deemed necessary. But, extreme policy stances can lead to unintended results, and these likely contributed to the inflationary pressures witnessed in 2021 and 2022. Savers can once again get a decent return on their cash and short-term investments. Yes, mortgage rates are much higher than they were 18 months ago, but are now back to more “normal” levels following some arguably dangerous distortions in housing pricing during the pandemic fueled by cheap financing. In short, we are finding a balance, and it appears that the economy can stand on its own two feet.
Outlook & Positioning Summary
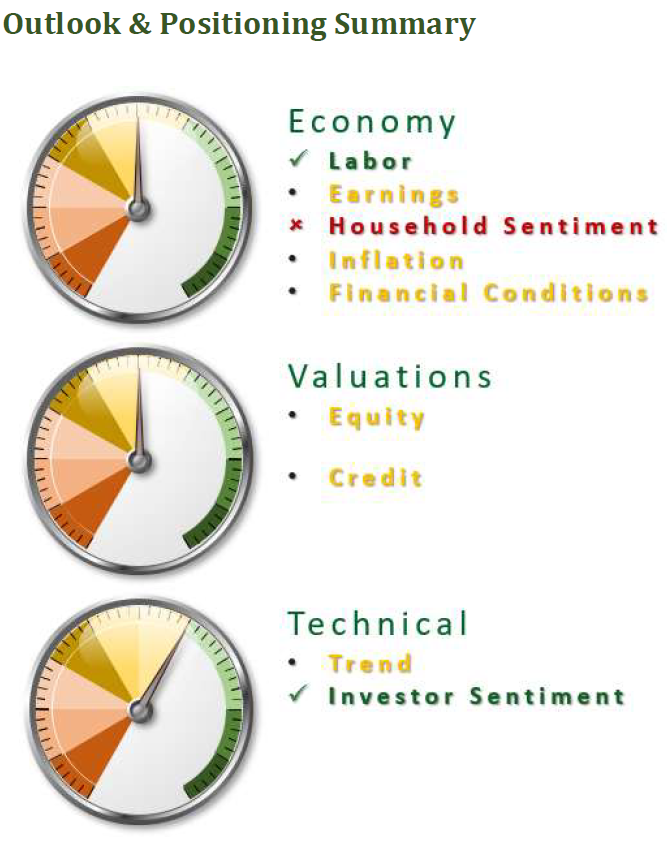
Economy
The US labor market has been a key pillar of strength that is likely supporting household confidence in spending as well.
Household sentiment has been turning lower over the last few months after gaining momentum since last summer. This is a reason to be cautious as household spending activity drives a large portion of economic growth.
Inflation has begun to show signs of softening (notably home and energy prices) which may lead to a Fed pause in the near future.
Valuation
Market-weighted indices look fairly priced today, but we believe there are attractive values across many parts of the market despite this year’s significant rally in large cap tech stocks.
Technical
Stocks have attempted to re-enter a long-term uptrend multiple times since mid-2022, but none have yet proven sustainable, at least not for large cap US stocks.
Investors remain more bearish than average.
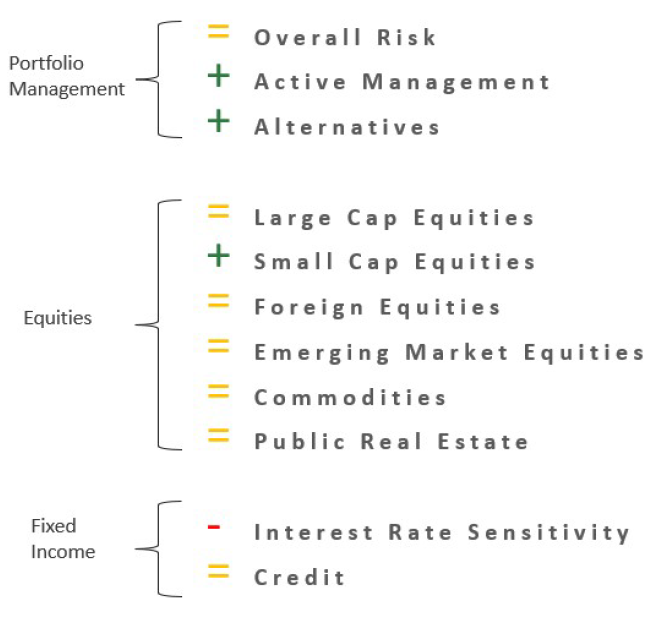
Positioning
Overall risk versus target is neutral as markets do not appear overly cheap or expensive and economy may be entering a “muddle through” period.
Favor active management and flexible alternative strategies as market volatility may have created pockets of opportunity beneath the surface.
Overweight US small cap stocks as valuations appear attractive.
Remain cautious on interest rate sensitive investments while Fed continues to increase interest rates.
Prices & Interest Rates
| Representative Index | May 2023 | Year-End 2022 |
|---|---|---|
| Crude Oil (US WTI) | $68.09 | $80.26 |
| Gold | $1,964 | $1,819 |
| US Dollar | 104.33 | 103.52 |
| 2 Year Treasury | 4.40% | 4.41% |
| 10 Year Treasury | 3.64% | 3.88% |
| 30 Year Treasury | 3.85% | 3.97% |
Asset Class Returns
| Category | Representative Index | 1 Month | YTD | 1 Year | 3 Years | 5 Years |
|---|---|---|---|---|---|---|
| US Large Cap Equity | S&P 500 | 0.4% | 9.7% | 2.9% | 12.9% | 11.0% |
| US Large Cap Equity | Dow Jones Industrial Average | -3.2% | 0.3% | 2.0% | 11.3% | 8.5% |
| US All Cap Equity | Russell 3000 Growth | 4.3% | 19.8% | 9.2% | 12.3% | 13.1% |
| US All Cap Equity | Russell 3000 Value | -3.8% | -1.6% | -5.0% | 11.7% | 6.5% |
| US Small Cap Equity | Russel 2000 | -0.9% | 0.0% | -4.7% | 9.2% | 2.7% |
| Global Equity | MSCI All-Country World | -1.1% | 7.7% | 0.9% | 10.1% | 6.8% |
| Global Equity | MSCI All-Country World ESG Leaders | -0.9% | 8.2% | 0.8% | 9.6% | 7.2% |
| Foreign Developed Equity | MSCI EAFE | 4.2% | 6.8% | 3.1% | 8.5% | 3.2% |
| Emerging Market Equity | MSCI Emerging Markets | -1.7% | 1.1% | -8.5% | 3.5% | -0.7% |
| US Fixed Income | Bloomberg Barclays US Agg. Bond | -1.1% | 2.5% | -2.1% | -3.6% | 0.8% |
| US Fixed Income | Bloomberg Barclays Municipal Bond | -0.9% | 1.7% | 0.4% | -0.6% | 1.7% |
| Global Fixed Income | Bloomberg Barclays Global Agg. Bond | -2.0% | 1.4% | -4.5% | -4.7% | -1.2% |