
Executive Summary
The market recovery began late last summer despite headlines and investor sentiment still being gloomy: “bull markets climb a wall of worry.”
The collective market narrative today has shifted toward optimism, which may be reason for caution: “be fearful when others are greedy and be greedy when others are fearful.”
Large companies like Apple, Microsoft and Amazon have rallied approximately 40-60% this year1YCharts as of July 31, 2023 and look to be fairly priced, at best: a good company and a good investment aren’t always the same thing.
If the economy continues to advance, we expect the rally to continue broadening to other asset classes such as small cap, value, and foreign equities, though the future direction of the economy is still uncertain.
One Chart You Need: Concentration
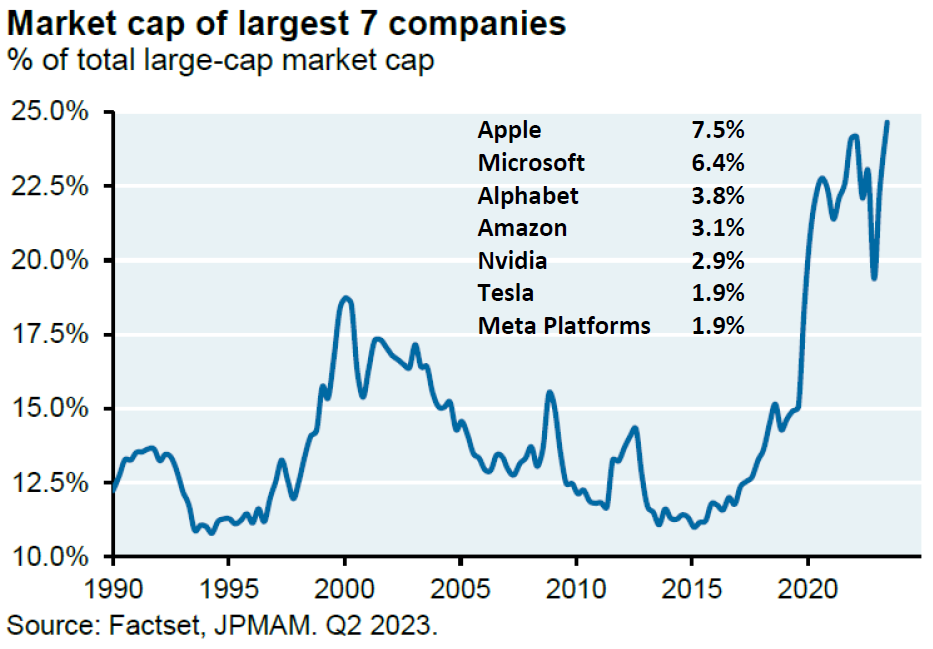
The largest US companies increasingly dominate the S&P 500 index. The largest seven now represent 25% of the index. Why is this important? These companies now trade for nearly 13x expected sales next year and 43x expected earnings, on average.2Bloomberg To be clear, these are wonderful companies that have enormous competitive advantages, are leaders in their respective areas, and are heavily investing in research & development to maintain their dominance. Companies like Apple and Microsoft, while they are formally listed as technology companies, have become so central to our personal and professional lives that they could almost be thought of as the utilities of the modern era. Imagine living without your iPhone or working without Microsoft Office – you almost can’t. These competitive advantages may be fully priced into these companies today, which gives us pause, and we are increasingly looking beyond the largest US companies to find value. A good company and a good investment are not the same thing if an investor overpays for the opportunity.
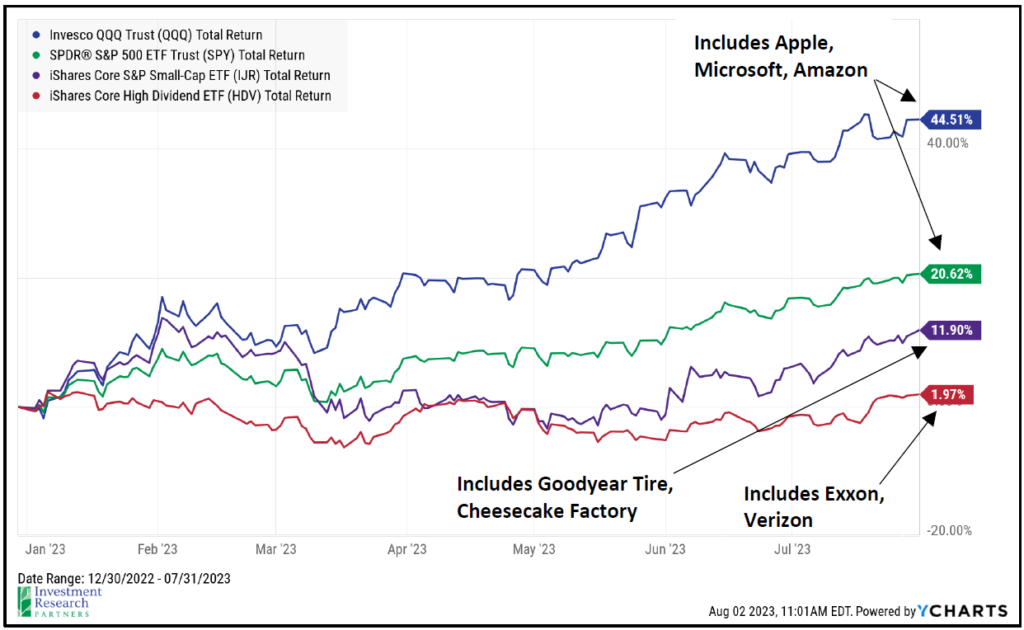
The 2023 rally continued in July. Large US companies continued to show leadership, but encouragingly, assets like small cap stocks showed strength as well, gaining 6%.3YCharts as of July 31, 2023 The broadening out of the market recovery may have been driven by a collective psychological shift away from the idea that the US will face a meaningful recession in 2023. In other words, the conventional wisdom and market narrative has shifted in favor of a more durable economy. At the same time, key inflation measures have continued to trend toward more “normal” levels that will provide the US Federal Reserve with cover to potentially end their interest rate hiking cycle (the most aggressive cycle in 40 years).4Based on pace and change from Fed Funds rate before initial rate increase. Data from Bloomberg as of July 31, 2023. And the labor market has remained as resilient as ever; the US has notched a record number of employed Americans every month since July 2022, and the unemployment rate remains pegged near a 50- year low (3.5% as of the July 2023 report).5Bureau of Labor Statistics
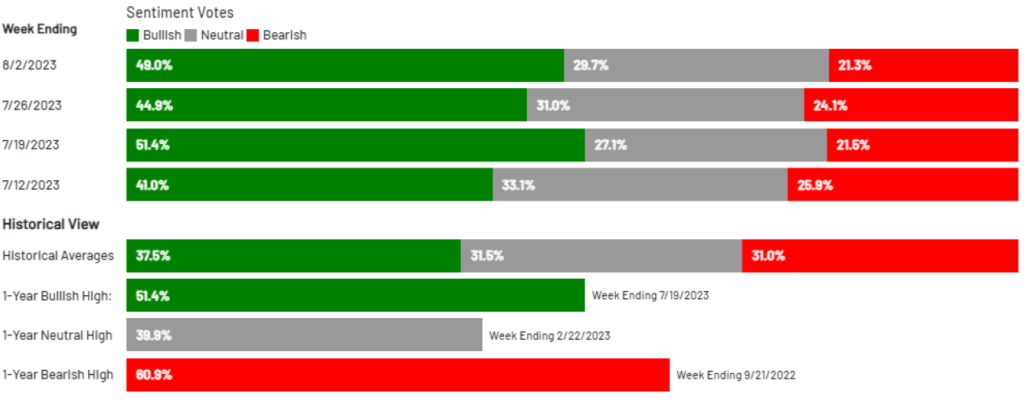
To be clear, our point is not that this narrative is wrong. In fact, this has been largely our view for the past year. We believe that the market has finally caught up to this view, and that is now more fully reflected in stock prices, particularly large US technology companies. We began seeing the investor sentiment pendulum begin to swing back toward positivity earlier this year when generative artificial intelligence tools like Chat GPT garnered headlines. Sentiment continued to strengthen as inflation showed signs of cooling, the Federal Reserve’s monetary policy became less aggressive, and economic growth remained resilient. Note that none of these factors are exceedingly positive. Relative to long-term averages, inflation is still elevated, the Fed’s monetary policy stance is still quite restrictive, and economic growth is modest. However, they all have surprised the consensus expectations of investors and economists in 2023, and that forced realignment of expectations is what has driven the market higher. Now, investor sentiment has quickly shifted toward optimism again, which gives us pause.
6American Association of Individual Investors

Going forward, we are becoming increasingly cautious in large US technology companies and are instead favoring areas where there may be relative value such as smaller US companies and foreign companies. Apple shares have appreciated more than 50% this year, and the company’s market capitalization is now larger than the bottom 200 companies in the S&P 500 index combined.7Goldman Sachs as of May 31, 2023 for this comment and the chart at right of the comment. This is not to say that Apple is a bad company, but rather a potential signpost that its price has gotten overextended. The price-to-earnings ratio of the S&P 500 now stands at 21x. When simply equally weighting the index constituents (as opposed to the standard convention of weighting based on company market capitalization), the ratio becomes 18x. At the same time, fixed income now offers investors some yield again, albeit skewed toward shorter-maturity bonds. We believe that the market today presents plenty of long-term opportunities for growth and the ability to “get paid to wait” from bond and dividend yields not seen for several years.

Source: Bloomberg, YCharts as of August 1, 2023. Market Markets represented by the Fidelity Government Money Market (FDRXX); Diversified Bonds represented by the iShares Aggregate Bond ETF (AGG); High Yield Bonds represented by the iShares High Yield Bond ETF (HYG)
Outlook & Positioning Summary

Economy
The US labor market has been a key pillar of strength that is likely supporting household confidence in spending as well.
Inflation has begun to show signs of softening (notably home and energy prices), and the Fed may be nearing the end of this rate hiking cycle.
Valuation
The largest US companies led the market higher in 2023, but we believe that opportunities are still abound in dividend, small, and foreign stocks, as well as within fixed income which offers 4-6% yields today on relatively defensive securities.
Technical
The S&P 500 may have entered a new bull market, though many other asset classes are still attempting to find their footing (potential value opportunities).
Investor sentiment quickly flipped to “normal” levels after having been very pessimistic for much of the last 18 months.
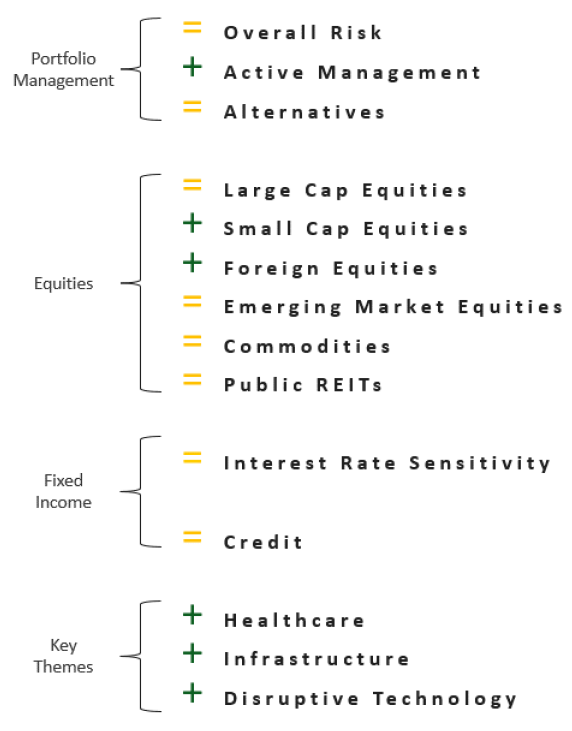
Positioning
Overall risk versus target is neutral as markets do not appear overly cheap or expensive and economy may be entering a “muddle through” period.
Favor active management as market volatility may have created pockets of opportunity beneath the surface.
Overweight US small cap stocks and foreign equities as valuations appear attractive.
Many portfolios have exposure to key long-term growth themes such as healthcare, infrastructure, and disruptive technology.
Prices & Interest Rates
| Representative Index | July 2023 | Year-End 2022 |
|---|---|---|
| Crude Oil (US WTI) | $81.80 | $80.26 |
| Gold | $1,971 | $1,819 |
| US Dollar | 101.86 | 103.52 |
| 2 Year Treasury | 4.88% | 4.41% |
| 10 Year Treasury | 3.97% | 3.88% |
| 30 Year Treasury | 4.02% | 3.97% |
Asset Class Returns
| Category | Representative Index | 1 Month | YTD | 2022 | 1 Year | 3 Years | 5 Years |
|---|---|---|---|---|---|---|---|
| US Large Cap Equity | S&P 500 | 3.2% | 20.7% | -18.1% | 13.3% | 13.7% | 12.2% |
| US Large Cap Equity | Dow Jones Industrial Average | 3.4% | 8.6% | -6.9% | 10.8% | 12.7% | 9.4% |
| US All Cap Equity | Russell 3000 Growth | 3.4% | 32.5% | -29.0% | 17.2% | 11.8% | 14.5% |
| US All Cap Equity | Russell 3000 Value | 3.8% | 8.9% | -8.0% | 8.3% | 14.3% | 7.9% |
| US Small Cap Equity | Russel 2000 | 6.1% | 14.7% | -20.4% | 8.0% | 12.0% | 5.1% |
| Global Equity | MSCI All-Country World | 3.7% | 18.1% | -18.4% | 12.8% | 10.4% | 8.3% |
| Global Equity | MSCI All-Country World ESG Leaders | 3.6% | 18.4% | -20.0% | 12.5% | 10.1% | 8.6% |
| Foreign Developed Equity | MSCI EAFE | 3.2% | 15.3% | -14.5% | 15.6% | 9.3% | 4.6% |
| Emerging Market Equity | MSCI Emerging Markets | 6.2% | 11.4% | -20.1% | 8.2% | 1.5% | 1.7% |
| US Fixed Income | Bloomberg Barclays US Agg. Bond | -0.1% | 2.0% | -13.0% | -3.8% | -4.5% | 0.8% |
| US Fixed Income | Bloomberg Barclays Municipal Bond | 0.4% | 3.1% | -8.5% | 0.8% | -1.0% | 1.9% |
| Global Fixed Income | Bloomberg Barclays Global Agg. Bond | 0.7% | 2.1% | -16.3% | -3.4% | -5.7% | -0.9% |
References
- 1YCharts as of July 31, 2023
- 2Bloomberg
- 3YCharts as of July 31, 2023
- 4Based on pace and change from Fed Funds rate before initial rate increase. Data from Bloomberg as of July 31, 2023.
- 5Bureau of Labor Statistics
- 6American Association of Individual Investors
- 7Goldman Sachs as of May 31, 2023 for this comment and the chart at right of the comment.