Executive Summary
We may have seen our last Federal Reserve interest rate increase for this cycle as a result of fading inflation and the banking crisis in March which served to tighten financial conditions. The rising Fed Funds rate has been a main focus for investors over the last year as higher rates tend to lead to slower economic growth and lower stock & bond prices.
We believe that fears of a significant recession are overblown, primarily because of the strength of the US labor market. This presents potentially attractive opportunities in areas like small-cap and value stocks which tend to have greater sensitivity to economic growth.
Investors have become very bearish as forces like inflation, the Ukraine War, higher interest rates, and slowing economic growth have weighed on sentiment. We believe the environment may be set up for a potential relief rally as the (current) bad news may be more than fully priced into stocks.
One Chart You Need: Investor Sentiment
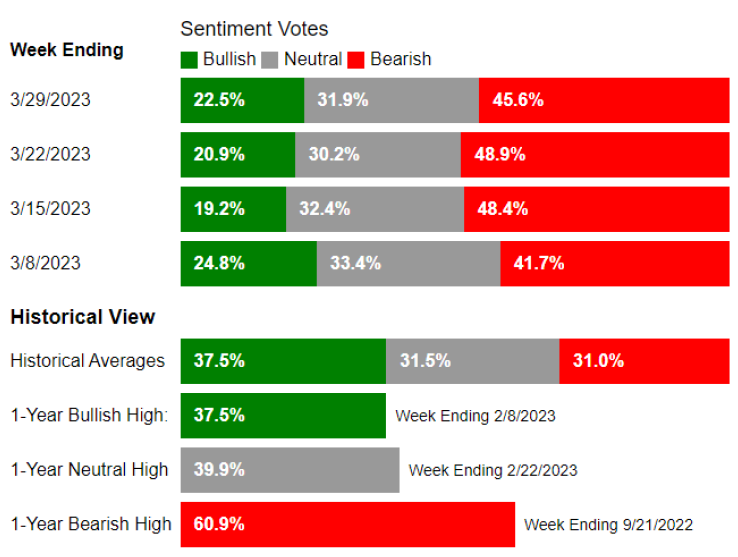
Since 1987, The American Association of Individual Investors has been conducting a simple survey that asks participants their thoughts on where the market will be in six months (higher, lower, or the same). Given that markets tend to advance in the long run driven by economic growth and innovation, it’s not surprising that “higher” (bullish) is the most common response (37.5% all-time average). Investor sentiment has been well below this long-term average for much of the last year, and the banking stress of March pushed the indicator to extreme pessimism once again. When comparing the historical survey responses and subsequent market returns, periods of significant pessimism tend to coincide with above-average future returns.1
“Be fearful when others are greedy, and greedy when others are fearful.”
Warren Buffett
1American Association of Individual Investors
March was a busy month. Most notably, Silicon Valley Bank was the largest US bank to fail since the financial crisis of 2008 as it experienced an extremely swift “run on the bank” after attempting to shore up its balance sheet (ironically, this public display of pushing toward greater financial conservatism actually led to the mass loss of depositor confidence). You can read our full take on SVB and the banking industry here. The Federal Reserve, Federal Deposit Insurance Corporation (FDIC), and the US Treasury acted swiftly to promote financial stability and implied in multiple press conferences that they stand ready to further act should the banking industry experience continued stress.
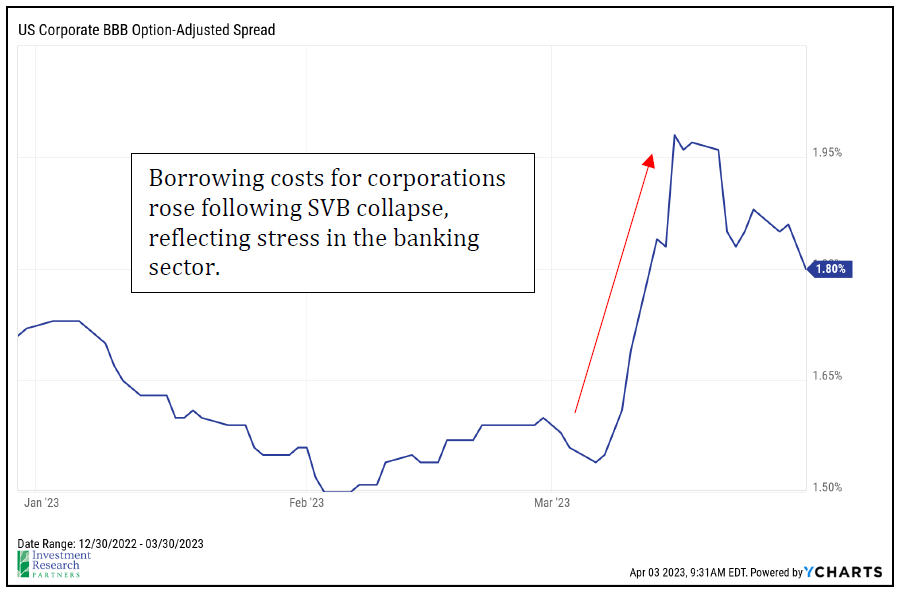
The collapse of SVB and subsequent stress in the banking industry may be the event that ends the US Federal Reserve’s interest rate hiking cycle. The Fed has been locked in a battle with inflation for over a year and has increased the base lending rate at a pace not seen in decades to levels not seen since 2007 (4.75-5.00% as of early April 2023). Higher rates had already begun impacting components of the Consumer Price Index (CPI) like energy, vehicles, and medical services which have been declining in cost in recent months, and the pace of food price growth has slowed toward more “normal” levels. Additionally, the median sales price for existing US homes has declined 8% over the last year.2 The Fed had already begun to signal that its rate hikes were near an end, and the banking industry stress could lead to higher borrowing costs as banks become more conservative with lending standards. In other words, the banking industry stress and tighter financial conditions may eliminate the need for additional rate hikes from the Fed to fight inflation. The chart below highlights the swift change by market participants in the expected Fed Funds rate over the next year. It is now expected that the Fed will begin reducing interest rates in the near future and trend back toward 3.5% by mid-2024. You can read our full update on the Fed here.

2 National Association of Realtors
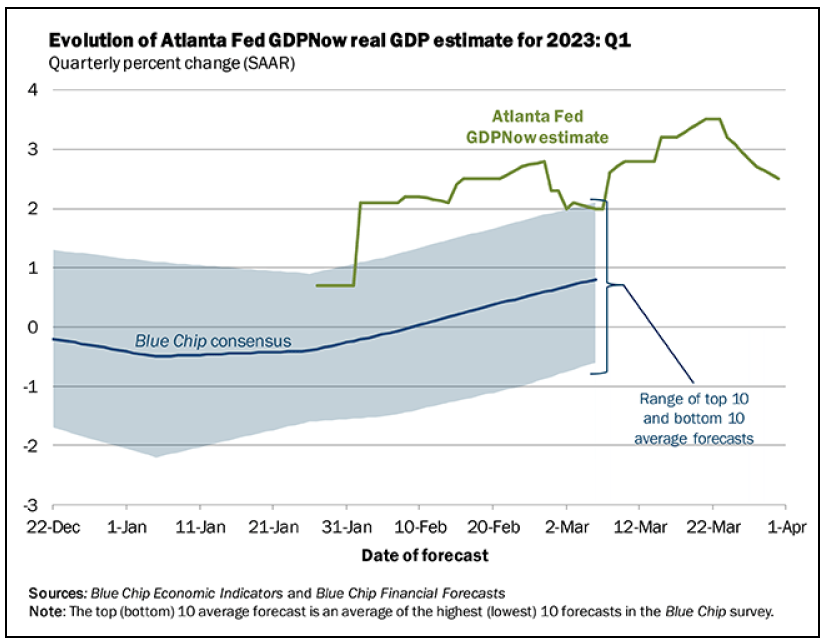
The next logical question one might ask is, “will all of these headwinds lead to a recession?”. Our base case is no, or at least not a meaningful one. This has been our expectation for the past 15 months of market anxiety, which is now being confirmed by economists and the Atlanta Fed GDPNow estimate. Of course, there can always be unpredictable surprises like COVID was in 2020, but the labor market has shown so much strength and resilience in the face of higher interest rates that it was very difficult to see a real pullback in household activity, which drives roughly two-thirds of US gross domestic product (GDP). The shift toward remote work may be helping the labor market to remain so resilient as many workers can now find new opportunities across the country as opposed to within only commuting distance from their homes.


So, the next thing you should do as an investor who believes expectations are too pessimistic, is look for good long-term opportunities that may be unfairly punished or discounted because of said pessimism. Two potentially interesting areas today are small cap and foreign stocks.3 Foreign stocks have struggled recently, largely because of geopolitical concerns in Europe and China (you can read our most recent pieces on Europe and China here and here). Small-cap US companies have underperformed their large-cap peers this year, presumably driven by increased fears that the US will enter a meaningful recession over the next few quarters. Small caps, as a group, now trade below their long-term averages, and they may present the opportunity for active stock pickers to add value through careful selection.
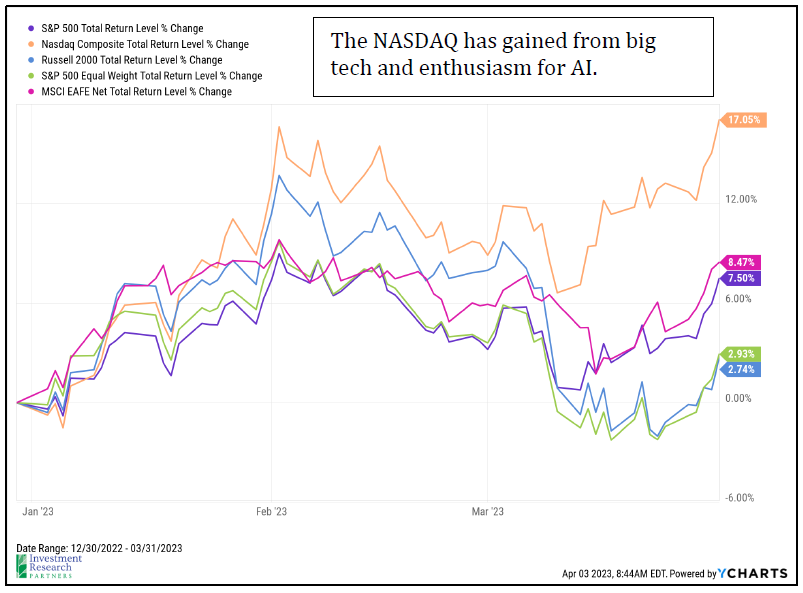
The NASDAQ composite has meaningfully outperformed many other indices this year for two primary reasons. One, as fears of a recession, have increased, large well-capitalized companies like Apple and Microsoft may be seen as safe havens. Secondly, there has been a palpable excitement around the potential for artificial intelligence (AI) tools like ChatGPT to drive significant efficiencies for years to come. Companies that design artificial intelligence semiconductors (“computer chips”) like Nvidia have seen their stocks soar in 2023. The NASDAQ has returned 17% this year and the S&P 500 has gained nearly 8%. Interestingly, beneath the surface, most companies weren’t so fortunate. The return in 2023 for the average stock was just 2.9%, as measured by the S&P Equal Weight index. Nevertheless, the combination of market pessimism, fading inflation, a less hawkish Federal Reserve, reasonably priced stocks, and a catalyst for optimism (such as AI) may set up for a relief rally in 2023. We remain cautiously optimistic.
Many parts of the market are trading at attractive levels again, but not yet exceedingly cheap. A summary of our recommended positioning can be found on the following page, which highlights that an overall neutral stance toward risk is still appropriate today (neutral to the target risk level deemed suitable for your portfolio as part of discussions and planning with your financial advisor). Beneath the surface, we seek to add value through selective exposure to more compelling areas mentioned in this piece such as small cap equities. Please contact us for a more detailed review of your portfolio.
3Chart at right from JPMorgan Guide to the Markets as of March 31, 2023. *Averages for U.S. High Yield and U.S. Small Cap are since January 1999 and November 1998, respectively, due to limited data availability. **Yield-to-worst and spread-to-worst are inversely related to fixed income prices. ***Munis yield-to-worst is based on the tax-equivalent yield-to-worst assuming a top-income tax bracket rate of 37% plus a Medicare tax rate of 3.8%.
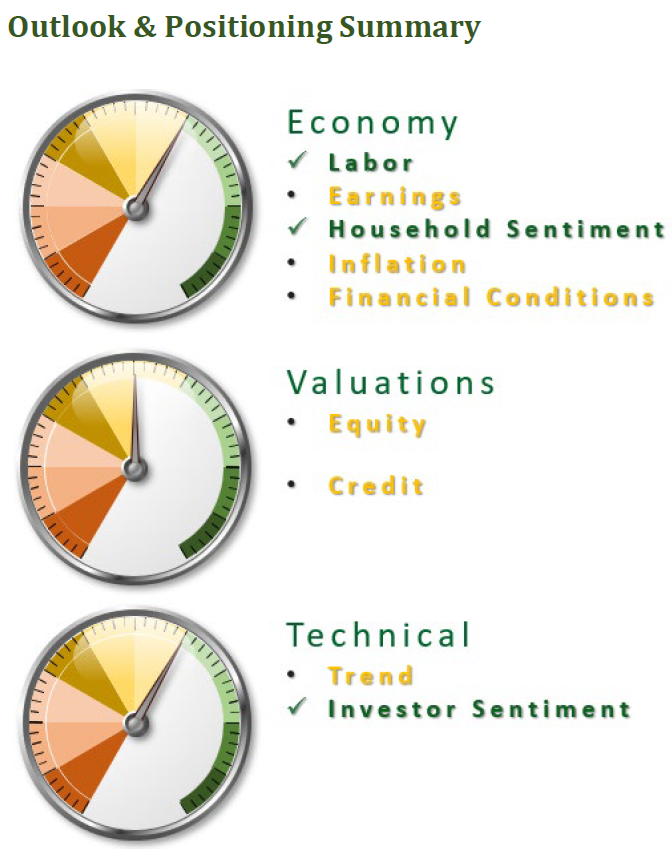
Outlook & Positioning Summary
Economy
The US labor market has been a key pillar of strength that is likely supporting household confidence in spending as well.
Inflation has begun to show signs of softening (notably home and energy prices), which has led to increasing household sentiment
Valuation
Stocks and bonds, on average, appear fairly valued today, but beneath the surface there may be many pockets of opportunity created by violent upheaval in markets during 2022.
Technical
Stocks have attempted to re-enter a long-term uptrend multiple times since mid-2022, but none have yet proven sustainable, at least not for large cap US stocks.
Investors turned fairly bearish in March, which may present a contrarian buying opportunity.
Positioning
Overall risk versus targets neutral as markets do not appear overly cheap or expensive and economy may be entering a “muddle through” period.
Favor active management and flexible alternative strategies as market volatility may have created pockets of opportunity beneath the surface.
Overweight US small cap stocks as recession fears may be overblown.
Remain cautious on interest rate sensitive investments while Fed continues to increase interest rates, but actively working now to reduce past underweight that has benefitted portfolios in 2022.
Prices & Interest Rates
| Representative Index | March 2023 | Year-End 2022 |
|---|---|---|
| Crude Oil (US WTI) | $75.67 | $80.26 |
| Gold | $1,969 | $1,819 |
| US Dollar | 102.51 | 103.52 |
| 2 Year Treasury | 4.06% | 4.41% |
| 10 Year Treasury | 3.48% | 3.88% |
| 30 Year Treasury | 3.67% | 3.97% |
Asset Class Returns
| Category | Representative Index | Mar 2023 | YTD 2023 | 1 Year | 3 Years | 5 Years |
|---|---|---|---|---|---|---|
| US Large Cap Equity | S&P 500 | 3.7% | 7.5% | -8.0% | 19.5% | 11.7% |
| US Large Cap Equity | Dow Jones Industrial Average | 2.1% | 0.9% | -2.4% | 18.3% | 9.4% |
| US All Cap Equity | Russell 3000 Growth | 6.3% | 13.9% | -11.2% | 19.4% | 13.6% |
| US All Cap Equity | Russell 3000 Value | -0.9% | 0.9% | -6.8% | 19.2% | 7.8% |
| US Small Cap Equity | Russel 2000 | -4.8% | 2.7% | -12.5% | 19.9% | 5.2% |
| Global Equity | MSCI All-Country World | 3.1% | 7.3% | -7.6% | 16.4% | 7.2% |
| Global Equity | MSCI All-Country World ESG Leaders | 3.5% | 7.3% | -8.0% | 15.8% | 7.5% |
| Foreign Developed Equity | MSCI EAFE | 2.5% | 7.8% | -0.9% | 14.3% | 3.5% |
| Emerging Market Equity | MSCI Emerging Markets | 3.0% | 4.0% | -11.0% | 8.3% | -0.9% |
| US Fixed Income | Bloomberg Barclays US Agg. Bond | 2.5% | 3.0% | -4.5% | -2.8% | 0.9% |
| US Fixed Income | Bloomberg Barclays Municipal Bond | 2.2% | 2.8% | 0.3% | 1.2% | 2.0% |
| Global Fixed Income | Bloomberg Barclays Global Agg. Bond | 3.2% | 3.0% | -7.5% | -3.4% | -1.4% |


