
Executive Summary
A handful of large US technology companies have powered the market higher this year, driven by enthusiasm that artificial intelligence will lead to significant gains in revenue and profits.
The market recovery began late last summer despite headlines and investor sentiment still being gloomy: “bull markets climb a wall of worry.”
The robust labor market and resilient households have powered economic growth in 2023.
If the economy continues to advance, we expect the rally to broaden to other asset classes such as small cap, value, and foreign equities, though the future direction of the economy is still uncertain.
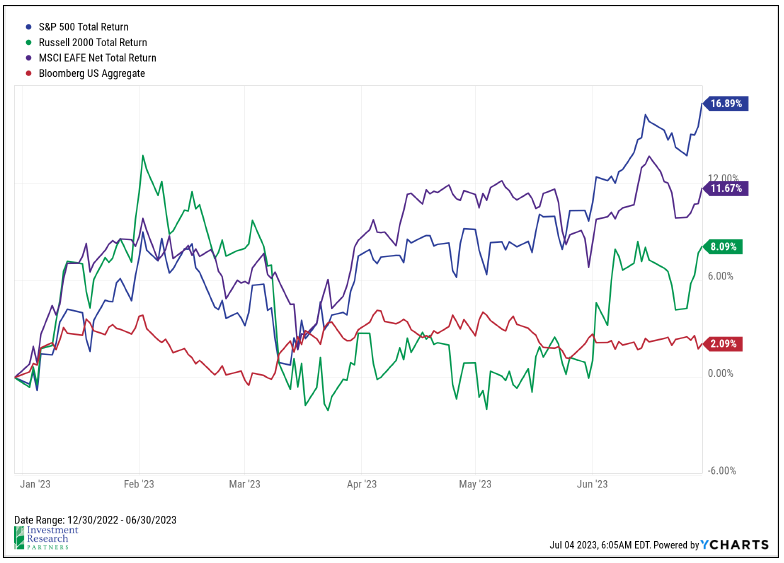
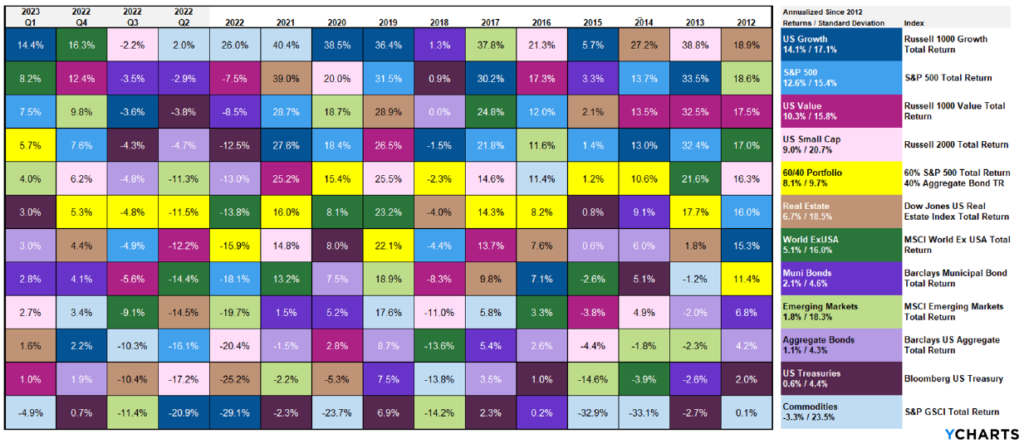
Markets have staged a robust recovery in 2023. Through mid-year, large US companies, as measured by the S&P 500 index, have gained 17%, led by technology stocks. Foreign and small cap equities have gained 12% and 8%, respectively. Bonds have produced a positive return this year after one of their worst years on record in 2022. Market sentiment has certainly shifted positively this year, and in this letter we will explore what could lie ahead for the remainder of 2023 and beyond. But first, we will examine some of our predictions made to start the year, and how they’ve held up so far.

Our 2023 outlook piece was titled, “The Year of Dispersion”. The premise of that title was that less central bank intervention would lead to an era of more clear winners and losers in the market, and that active management was essential for navigating the environment ahead. Directionally, that idea was correct, but in very unexpected ways. The two big stories of 2023, so far, were the banking crisis (led by the collapse of Silicon Valley Bank in March) and the excitement (seemingly justified) toward artificial intelligence and its potential to enhance efficiencies across the economy. Large technology companies powered higher in the first half, led by the hope of greater future profits from the potential benefits of AI, while regional banks collapsed as depositors and investors questioned their very viability.
| 2022 Challenge | Potential 2023 Tailwind? |
|---|---|
| Inflation | Most components of Consumer Price Index have begun to decline; supply chains easing, China reopening, wage growth slowing. |
| Federal Reserve Policy | Fed already beginning to soften language and pace of rate hikes. |
| Geopolitical Tensions | If stalemate persists, Russia may look for off-ramp. China does not want to repeat Russia’s mistake and is very reliant on Taiwan for semiconductors. |
| Valuations | Stocks and bonds trading much closer to long-term averages with greater dispersion (more potential for active managers to add value) |
We also laid out the challenges that ailed markets in 2022, and their potential to represent tailwinds in 2023. Inflation, Federal Reserve Policy, the Ukraine War, China / Taiwan tensions, and above-average valuations all plagued investor sentiment in 2022, but they had the potential to allow for markets to recover in 2023 should they abate.
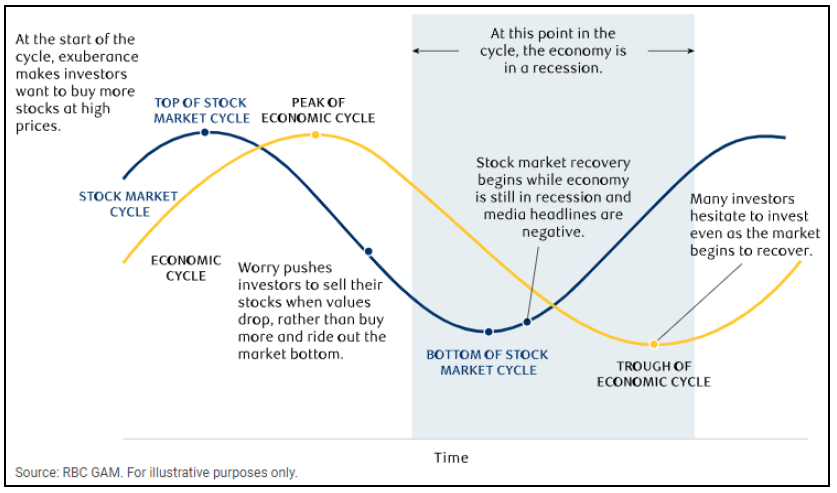
First, we must revisit the concept that markets tend to lead the economy. The great quote from economist, Paul Samuelson, “The stock market has predicted nine of the last five recessions” seems appropriate today. We shared the chart below in The Year of Dispersion, which illustrates how markets, seeking to anticipate the future direction of the economy and the future profitability of companies, tends to peak and trough before the economy. Thus, like many cycles before, the market began to trough late last summer when things still felt pretty bad and began to “climb a wall of worry”. Costs were rising by nearly 10% year-over-year and the Federal Reserve was still less than halfway through their most aggressive interest rate hiking cycle in four decades. But, history and experience tell us that markets tend to look for inflection points. The turn lower in inflation and move higher in household sentiment sparked a stock market rally that pushed the S&P 500 nearly 20% higher over the last year, seemingly giving rise to a new bull market.
From The Year of Dispersion:
“Our S&P 500 target for year-end 2023 is 4,000-4,500, which is an expression of our cautiously optimistic view toward markets and a recovery. This equates to a 5-18% expected return for 2023 when including dividends. The low end of the range assumes that revenue growth, profit margins, and price-to-earnings multiples trend toward long-term (20-30 year) averages while the higher end of the range assumes that these factors remain closer to their 5-year averages. Of course, a significant recession (which is not our base case expectation) would likely lead to the S&P 500 underperforming this expectation.”
As of June 30th, the S&P 500 sits just shy of 4,500, the high end of our predicted range for the end of 2023. Markets have moved swiftly this year, led predominately by large technology companies. Just as we advised clients to “lean into” dislocated assets like stocks in later 2022 and early 2023, it now may be time to proceed with a bit of caution, particularly with respect to large US tech companies that have become investor darlings. “Be greedy when others are fearful and fearful when others are greedy” as the great Warren Buffett would say.
Federal Reserve
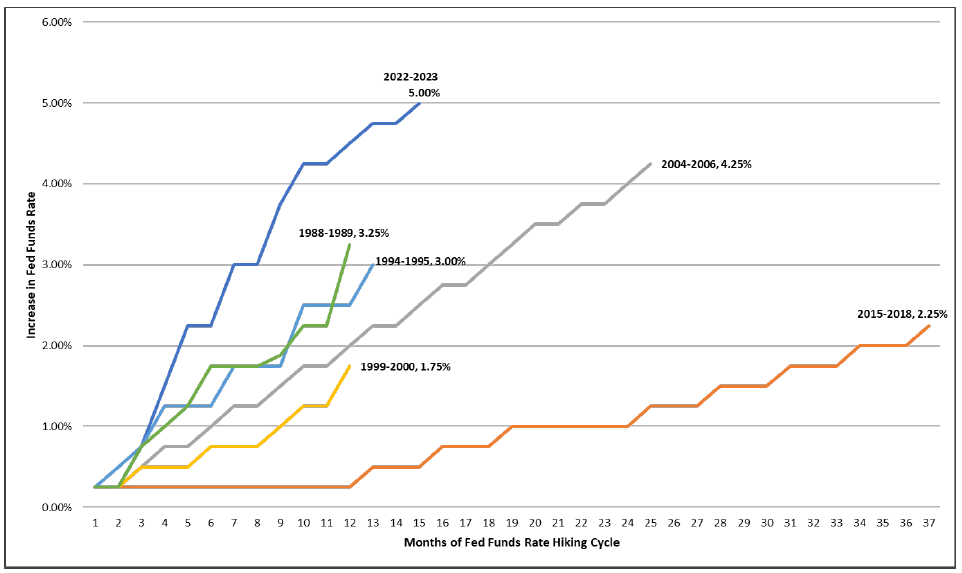
As of mid-2023, we still cannot say that we’ve seen the last interest rate increase from the US Federal Reserve for this cycle. It has been the fastest and steepest interest rate increasing cycle in the last 40 years, with short-term rates now above 5% for the first time in more than 15 years, but key members of the Fed have communicated that more interest rate hikes in the second half of 2023 are still on the table. Nevertheless, we are almost certainly much closer to the end than the beginning, which has historically been a good time for markets, on average. The most recent example, highlighted in the chart below, was late 2018 as the Fed had continued to increase interest rates into a weakening economy, which caused a sharp market selloff in the fourth quarter of that year. For context, the Fed had only raised rates to 2.25% before throwing in the towel leading to a sharp market recovery. This cycle, investors have been closely watching trends in inflation and the language of the Federal Reserve officials for clues as to when the rate hiking cycle will be over. What is sometimes lost is just how resilient the US economy and households have been in the face of the highest interest rates in nearly a generation, and the fact that savers can finally earn a decent return on their cash and bonds, once again.

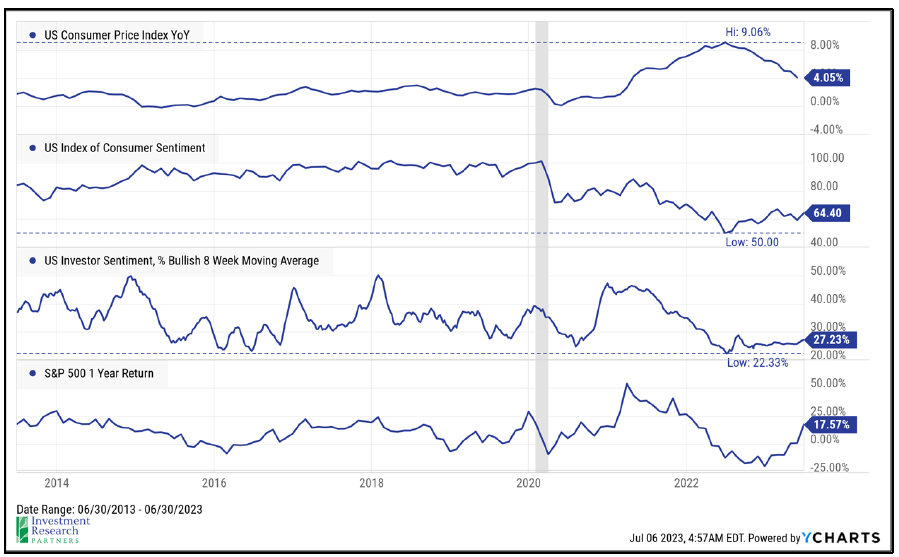
Despite calls for a Fed-induced recession in 2023, so far economic growth has continued, likely aided by a robust labor market and households in relatively good financial shape, on average. Ultra-low interest rates during the pandemic allowed many to refinance their mortgages, and as a result, household debt service as a percentage of disposable income and mortgage delinquencies are very low. Credit card debt is on the rise, which is one area of concern. The labor market continues to power higher, with a record number of employed Americans every month since July 2022. And, despite rumblings of the potential for a recession, the number of job openings remains very high. There are more than 10 million job openings in the US, which is nearly two available jobs for every person seeking one.


Inflation seems to have peaked during summer 2022, and we are approaching more normal levels again. The most recent reading of the Consumer Price Index was 4.1%. In other words, the average basket of goods for the average household cost 4.1% more last month than a year prior. Year-over-year CPI has averaged 2.6% since the year 2000, so it appears that we are not far from “normal” levels which should allow the Fed to be less aggressive with their monetary policy going forward.
Valuation

Finding bargains in the market is much easier in 2023 than 2021. Large US companies, particularly growth-oriented ones, are still priced a bit rich, but value, small cap, foreign equities, and bonds all look interesting to us. US Treasury bonds, depending on the maturity, offer yields of 4-5%, and investment grade corporate bonds offer greater than 5%.1Source: YCharts as of June 30, 2023. Market Markets represented by the Fidelity Government Money Market (FDRXX); Short-Term Treasury Bonds Represented by the iShares 1-3 Year Treasury ETF (SHY); Long-Term Bonds represented by the iShares 7-10 Year Treasury ETF (IEF); Diversified Bonds represented by the iShares Aggregate Bond ETF (AGG); High Yield Bonds represented by the iShares High Yield Bond ETF (HYG). US small cap stocks are trading at some of the widest discounts to large cap stocks in decades. Foreign stocks, despite a double-digit gain in 2023, still look to offer relative value.
2023 has been another year of robust returns by the S&P 500, and the index has now generated nearly 13% per year for the last 10 years.2YCharts as of June 30, 2023 In an environment like this, it’s natural to ask ourselves: “why should I own anything else?” We are firm believers in the benefits of diversification, particularly in its ability to provide a smoother ride for our clients in achieving their long-term financial goals. Commodities, for example, have struggled for several years, but this group benefited investors in the inflationary environment of 2021 and 2022 with double-digit returns. We expect that asset classes like small cap and foreign stocks will have their time of leadership again as well.
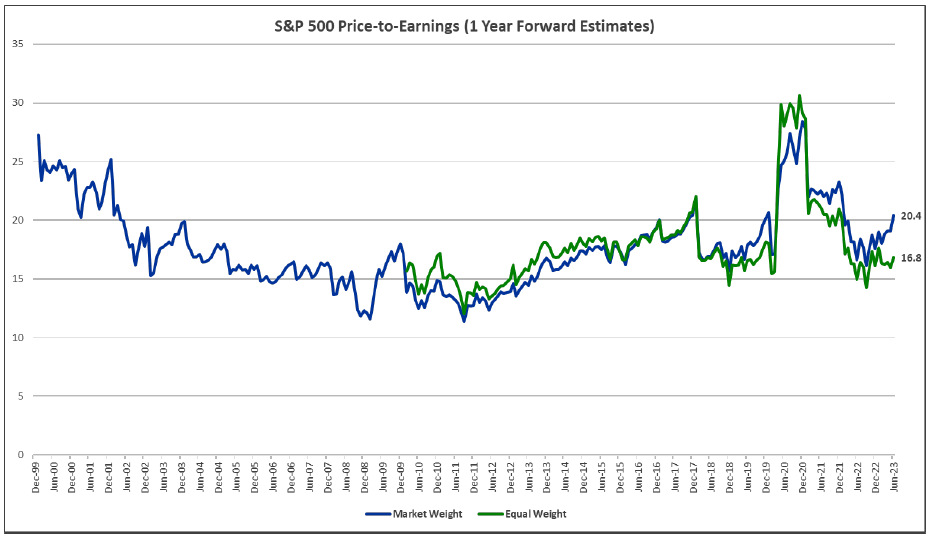
US large cap stocks appear reasonably priced when removing the impact of the largest technology companies.
Source: Bloomberg as of June 30, 2023
US small cap stocks trading at a near-record discount to large caps today.
Source: Bloomberg as of June 30, 2023

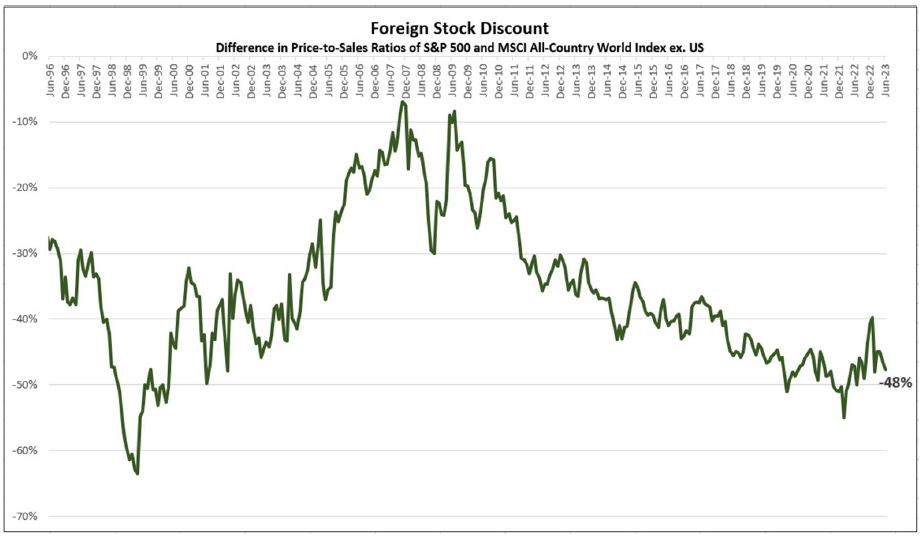
Foreign stocks trading at a near-record discount to US stocks today.
Source: Bloomberg as of June 30, 2023
Second Half Outlook
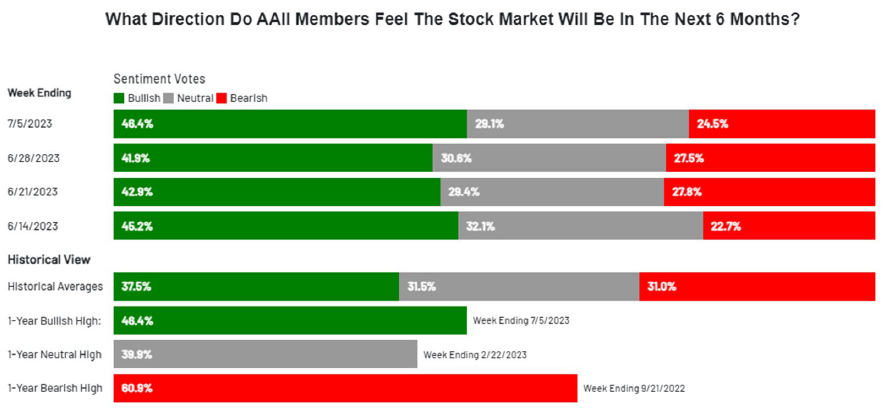
We began the year by declaring a 4,000-4,500 target for the S&P 500 during 2023. As of mid-year, the S&P 500 has gained 17% and is just shy of the top-end of our full-year range. Investor sentiment has moved back toward normal levels, after having been exceedingly pessimistic for much of the last 18 months.3American Association of Individual Investors This is not to say that markets cannot continue to advance for the remainder of the year, but the opportunity to take advantage of extreme pessimism may have passed, at least for now. We will maintain a healthy exposure to large US companies, but increasingly be seeking assets that offer more compelling value, in our opinion, such as small cap and foreign equities. Relatively low risk bonds offer yields of 4-6% again, which allows us to get paid to be a bit more defensive and liquid in portfolios while waiting for stock market dislocations to avail themselves. And, long-term growth themes such as innovative healthcare, renewable energy, and infrastructure remain staples in most of our clients’ portfolios.

When looking for potential catalysts to spur higher US economic growth and assets like small cap and value stocks, the potential for a US manufacturing renaissance hasn’t gotten as much attention as it may deserve. The massive supply chain disruptions caused by the pandemic and then exacerbated by the War in the Ukraine seem to have refocused the attention business and government leaders toward reshoring manufacturing (or at least “near-shoring” to places like Mexico over Asia). At the same time, government incentives for making electric vehicles and semiconductors (“computer chips”) in the US are also driving demand for renewed US manufacturing. Enhanced automation may also support demand as these tools enhance productivity per worker and create a better relative value proposition compared to less expensive workers in Asia. In The Year of Dispersion, we highlighted US manufacturing activity as a potential sign of a turning point in markets. The Purchasing Managers Index remains in decline (a reading below 50), but we are optimistic that the bottom may be near, and the level of US of US manufacturing construction spending, which we have not seen in generations, will lead to expansion over the next few years.

We remain enthusiastic about long-term themes such as healthcare, renewable energy, electric vehicles, automation, and artificial intelligence. Many of our portfolios contain significant exposure to innovative healthcare companies seeking to cure diseases. The pace and cost of performing innovative medical research have improved exponentially in the last few decades, and we anticipate that to continue. In The Year of Dispersion, we highlighted the infamous ARK Innovation fund which had become the posterchild for irrational exuberance amongst investors in 2021. Much like we witnessed in the late 1990s during the “dot-com” bubble, great themes and companies did not make for great investments because their prices had become so divorced from their fundamentals. An investment in Microsoft, one of the greatest companies in history, at the end of 1999 was underwater until mid-2014. Investors chose the right themes and company, but they significantly overpaid. Highlighted at left is the performance of the ARK Innovation fund (top chart) and investor cash flows (bottom chart).4Source: Morningstar as of July 3, 2023. Index: Morningstar US Mid Cap Growth. Category: Mid-Cap Growth A large portion of the fund’s inflows occurred very close to the peak in performance, but now that the fund is trading significantly cheaper, flows have dried up. That makes us interested. Themes like healthcare, renewable energy, electric vehicles, automation, and artificial intelligence have very significant long-term potential, so our job today is to find the right companies at the right prices.
Health Care Innovation
Precision medicine, commercial genetic tests, wearable diagnostic devices, gene editing, mRNA vaccine technology – the breadth and pace of health care innovation is difficult to articulate. Beginning with the Human Genome Project in 2003, a project which took 13 years to sequence 92 percent of the genome at a staggering cost of nearly three billion dollars, the idea that medicine needn’t be a generalized-for-the-masses industry, but rather a precision solution tailored to the individual, began to take root.5Source: Human Genome Project Fact Sheet Powered by rapid advancements in computing power and artificial intelligence (AI) that can detect patterns in complex genomics data sets (for more on AI, see the Disruptive Technology section below), the cost and time required to sequence the genome has plummeted over the past two decades (see graphic).6Source: The Cost of Sequencing a Human Genome The potential applications include things that would have sounded like science fiction even a decade ago. We believe this innovation has the potential to benefit society and economic growth as we extend lifespans and keep people active later into life. We also believe the current environment represents an attractive entry point for long-term investors.

“I think the biggest innovations of the 21st century will be at the intersection of biology and technology. A new era is beginning.”
Steve Jobs, Apple Co-Founder
Disruptive Technology

Much like health care innovation, artificial intelligence, cloud computing, advanced robotics, autonomous vehicles, digital wallets, and block chain technologies are disrupting industries across the global economy. Innovation is often thought of as technology sector specific, but advancements have the potential to impact everything from farming (precision farming driven by AI) and manufacturing (3D printing) to gaming (virtual reality) and bridge inspections (drone technology).
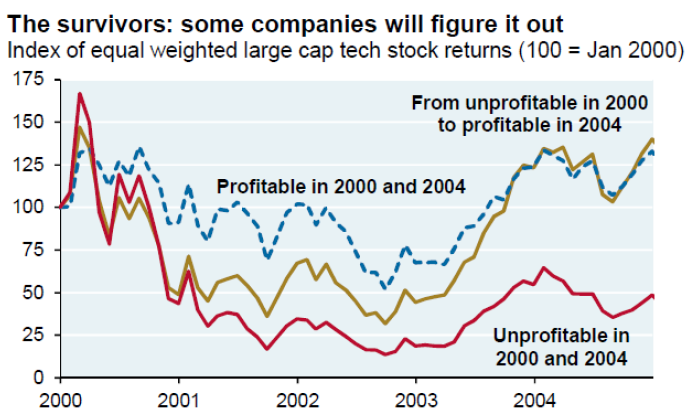
Disruptive technology stocks, driven in part by investment firms like ARK Innovation, accelerated upward much more steeply than traditional stocks during the Covid-19 rebound (for example, see the ARK Innovation ETF, blue line, versus the S&P 500 index at right). However, as inflation surged in 2022, companies focused on innovative technology found themselves in the eye of the storm and have retreated to a greater degree than broader equity indexes. Again, we believe this represents an attractive entry point for long-term investors who are able to select those companies with durable business models. After the “dot-com” bubble of the late 1990s, the ability to identify companies with a clear path to profitability versus those without was imperative.7JPMorgan Asset Management
Infrastructure
The need to improve infrastructure has long been a talking point in nearly every political speech, but the shortfall in funding continues to grow, nonetheless. Based on the most recent report from the American Society of Civil Engineers (ASCE), their assessment of the state of US infrastructure is a grade of C- (up modestly from D+ four years earlier). In order to improve that grade to a B, ASCE estimates that nearly $2.6 trillion will need to be spent on infrastructure in the US over the next decade.8Source: ASCE – National_IRC_2021-report.pdf (infrastructurereportcard.org) The infrastructure funding gap is not uniquely American either, spending will be needed in many areas of the world.9Source: Oxford Economics – Microsoft Word – 03_GIH report_20 July 2017 v8 (d2rpq8wtqka5kg.cloudfront.net)

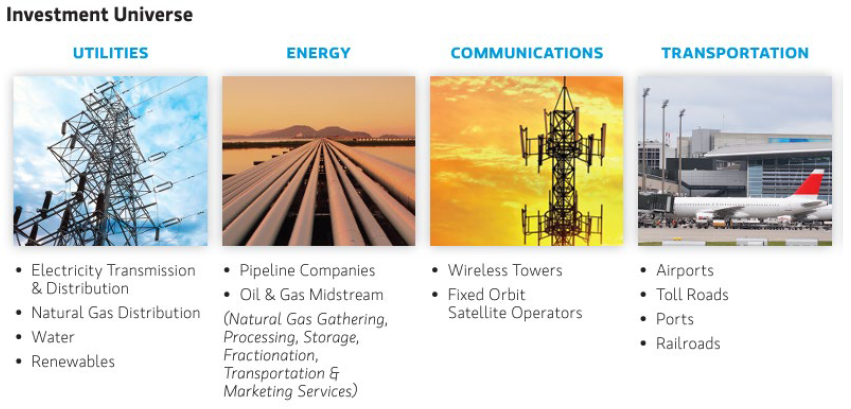
When investors think about infrastructure, traditional utilities, transportation, and pipelines all rightly come to mind. However, we also believe that broadband data, renewable energy, electric vehicle charging stations, and other low-carbon infrastructure are now, or at least should be as we move forward, part of the discussion. The Inflation Reduction Act, with its focus on climate change and clean energy, hammers this point home. As a result, our expanded definition of infrastructure includes both traditional and newer frameworks that are necessary for global economic development and continued improvements in the quality of life across the world. This is a theme we have been recommending throughout the year and we continue to advocate for exposure in client portfolios given the amount of investment needed globally.
The page that follows summarizes our outlook and portfolio positioning. Thank you for the privilege to advise you and steward your wealth. We are at your service to discuss the contents of this letter in greater detail. We look forward to a prosperous second half of 2023 and beyond together.
Outlook & Positioning Summary

Economy
The US labor market has been a key pillar of strength that is likely supporting household confidence in spending as well.
Inflation has begun to show signs of softening (notably home and energy prices), and the Fed may be nearing the end of this rate hiking cycle.
Valuation
The largest US companies led the market higher in 2023, but we believe that opportunities are still abound in value, small, and foreign stocks, as well as within fixed income which offers 4-6% yields today on relatively defensive securities.
Technical
The S&P 500 may have entered a new bull market, though many other asset classes are still attempting to find their footing (potential value opportunities).
Investor sentiment quickly flipped to “normal” levels after having been very pessimistic for much of the last 18 months.

Positioning
Overall risk versus target is neutral as markets do not appear overly cheap or expensive and economy may be entering a “muddle through” period.
Favor active management as market volatility may have created pockets of opportunity beneath the surface.
Overweight US small cap stocks and foreign equities as valuations appear attractive.
Prices & Interest Rates
| Representative Index | June 2023 | Year-End 2022 |
|---|---|---|
| Crude Oil (US WTI) | $70.45 | $80.26 |
| Gold | $1,928 | $1,819 |
| US Dollar | 102.92 | 103.52 |
| 2 Year Treasury | 4.87% | 4.41% |
| 10 Year Treasury | 3.81% | 3.88% |
| 30 Year Treasury | 3.85% | 3.97% |
Asset Class Returns
| Category | Representative Index | 1 Month | YTD | 1 Year | 3 Years | 5 Years |
|---|---|---|---|---|---|---|
| US Large Cap Equity | S&P 500 | 6.6% | 16.9% | 19.6% | 14.6% | 12.3% |
| US Large Cap Equity | Dow Jones Industrial Average | 4.7% | 4.9% | 14.2% | 12.3% | 9.6% |
| US All Cap Equity | Russell 3000 Growth | 6.9% | 28.1% | 26.6% | 13.2% | 14.4% |
| US All Cap Equity | Russell 3000 Value | 6.7% | 5.0% | 11.2% | 14.4% | 7.8% |
| US Small Cap Equity | Russel 2000 | 8.1% | 8.1% | 12.3% | 10.8% | 4.2% |
| Global Equity | MSCI All-Country World | 5.8% | 13.9% | 16.5% | 11.0% | 8.1% |
| Global Equity | MSCI All-Country World ESG Leaders | 5.7% | 14.3% | 15.6% | 10.5% | 8.5% |
| Foreign Developed Equity | MSCI EAFE | 4.6% | 11.7% | 18.8% | 8.9% | 4.4% |
| Emerging Market Equity | MSCI Emerging Markets | 3.8% | 4.9% | 1.8% | 2.3% | 0.9% |
| US Fixed Income | Bloomberg Barclays US Agg. Bond | -0.4% | 2.1% | -0.9% | -4.0% | 0.8% |
| US Fixed Income | Bloomberg Barclays Municipal Bond | 1.0% | 2.7% | 3.2% | -0.6% | 1.8% |
| Global Fixed Income | Bloomberg Barclays Global Agg. Bond | 0.0% | 1.4% | -1.3% | -5.0% | -1.1% |
References
- 1Source: YCharts as of June 30, 2023. Market Markets represented by the Fidelity Government Money Market (FDRXX); Short-Term Treasury Bonds Represented by the iShares 1-3 Year Treasury ETF (SHY); Long-Term Bonds represented by the iShares 7-10 Year Treasury ETF (IEF); Diversified Bonds represented by the iShares Aggregate Bond ETF (AGG); High Yield Bonds represented by the iShares High Yield Bond ETF (HYG).
- 2YCharts as of June 30, 2023
- 3American Association of Individual Investors
- 4Source: Morningstar as of July 3, 2023. Index: Morningstar US Mid Cap Growth. Category: Mid-Cap Growth
- 5Source: Human Genome Project Fact Sheet
- 6
- 7JPMorgan Asset Management
- 8Source: ASCE – National_IRC_2021-report.pdf (infrastructurereportcard.org)
- 9Source: Oxford Economics – Microsoft Word – 03_GIH report_20 July 2017 v8 (d2rpq8wtqka5kg.cloudfront.net)