
Inflation is moving lower, and economic data reports have surprised to the downside, but the Federal Reserve remains steadfast and likely to increase rates again at its July meeting next week after taking a pause in June. Why continue down this tightening path when it seems clear we are moving in the right direction? There are a few possibilities, and in this note, we will dig into some of the technical reasons why the June data may be overstating improvement in inflation. In addition, we will discuss the Fed’s preferred inflation measure, PCE, and the key differences from the more publicly followed CPI.
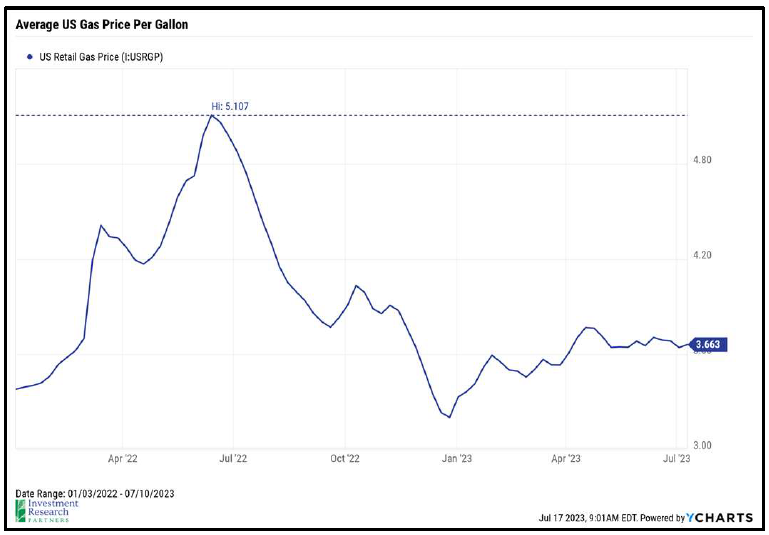
June inflation data released last week was much better than expected, including the year-over-year Consumer Price Index (CPI) falling to 3.0%, the lowest since March 2021, and down from 9.1% last June. This headline number is getting ever closer to the Fed’s 2.0% inflation target, so why is the Fed continuing to signal additional rate hikes may be coming this year? First, let’s think back to last June when that peak inflation reading of 9.1% was released. Russia’s invasion of Ukraine had caused a spike in food and energy prices, and gas prices in the US, on average, exceeded $5 per gallon. Energy prices declined dramatically in the second half of 2022 and have been relatively steady in 2023. Energy comprises nearly 7% of the CPI, so the lower level has contributed significantly to the reduction in CPI calculation thus far. This is one of the reasons the Fed focuses on “core” prices, which exclude the typically volatile food and energy components.

Another important consideration, if we can get technical for a second, is the role of base effects in the CPI calculation, which refers to the impact of comparing current price levels in a given month against price levels in the same month a year ago.1What are base effects and how do they distort inflation?: Yahoo U In other words, the very high inflation prints from last summer make for “easy” comparisons year-over-year, and those will start to fade out of the mathematical calculation beginning in July.
The Fed is concerned that, with the base effect improvement behind us, the final stretch of getting inflation to the 2% target is where the hard work lies. “Stickier” components of the CPI, including shelter and medical services, for example, adjust over a much longer horizon. Critically for consumers, a deceleration in the rate of inflation to 3%, while certainly something to cheer about compared to 9%, still means that prices are continuing to increase from very high levels. Consumers are still feeling the pain from high prices, and the Fed, bolstered by the unprecedented strength in the job market despite the tightening thus far, has not wavered from its commitment to bringing inflation down to the 2% target, even if it causes stress in other areas of the economy.
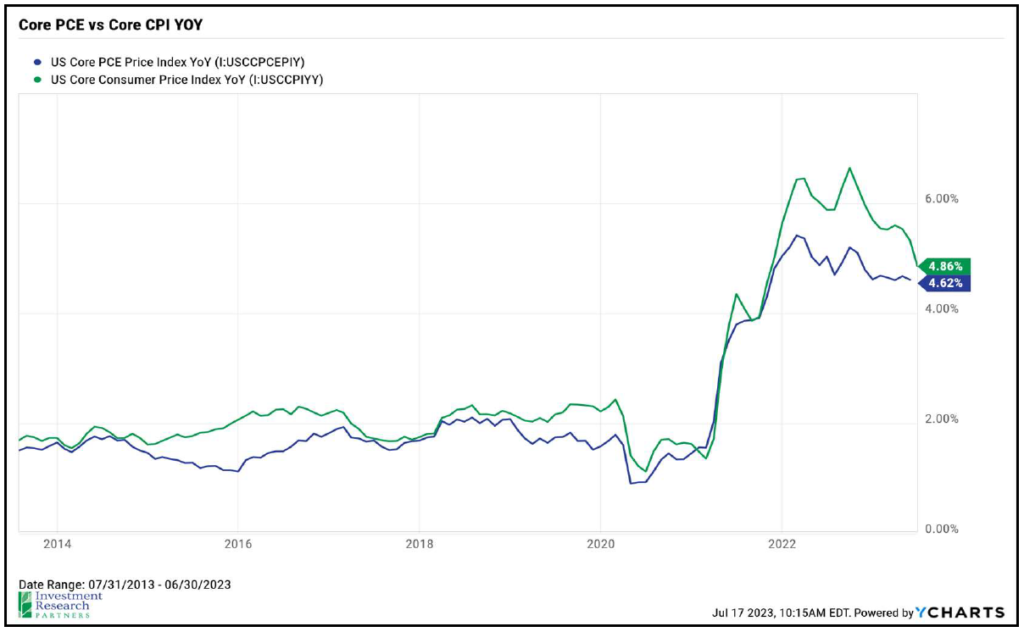
We mentioned previously that the Fed focuses on “core” prices to get a more accurate reading on the direction of inflation, and there is another economic indicator with less volatility than the CPI prices that we described above. The Personal Consumption Expenditures (PCE) is the Fed’s preferred inflation measure, especially the Core PCE deflator. At times the two indices move in tandem, but some key differences in weighting and calculation can cause divergence as well. In contrast to the CPI, the PCE data is collected from businesses (rather than directly from what consumers are spending) and includes more categories like spending on a consumer’s behalf from a third party, for example. PCE also gives a much smaller weight to shelter (owners’ equivalent rent in CPI), which is one of the primary drivers of the recent divergence. As shown in the chart below, Core PCE did not rise as much as Core CPI last year and likewise is not dropping as rapidly now.2FHN Financial, Bureau of Labor Statistics, Bureau of Economic Analysis as of July 14, 2023
To be sure, the Fed watches both indices and is broadly interested in the impact of prices on consumers. However, monitoring the Core PCE more closely may be instructive as it relates to the Fed’s decision to continue raising rates. Despite the encouraging CPI report last week, the Fed views Core PCE as a better measure of the inflation process that is not coming down fast enough. The Federal Reserve meeting is coming up next week, and the market is currently pricing in a more than 90% chance of another 25-basis point increase in the target interest rate.3Bloomberg WIRP as of July 17, 2023 The following Fed meeting is not until September 20th, so there will be two months of PCE and other inflation data in between meetings for the Fed and markets to consider. Current market expectations are that the Fed will need to keep short-term rates in the 5.25% area at least through the end of the year to combat the “stickier” elements of inflation.
In last month’s Bond Basics note, we concluded with the following optimistic point: “The good news for investors is that high-quality, conservative investments are available for relatively attractive yields, and fixed income can once again play its traditional roles in portfolios, including diversification, income, and stability.” This remains the case today, with short term Treasury bills and Certificates of Deposit (CDs) offering yields north of 5%. After years of a policy-induced zero percent interest rate environment, this is a welcome change adding value and balance to portfolios. As always, please feel free to contact us if you want to discuss your personal investments.
Fixed Income Markets
| Yield | Return | |||
|---|---|---|---|---|
| U.S. Treasuries | 7/13/2023 | 12/31/2022 | 2023 YTD | Avg. Maturity |
| 2-Year | 4.59% | 4.41% | 1.20% | 2 years |
| 5-Year | 3.93% | 3.99% | 1.64% | 5 |
| 10-Year | 3.76% | 3.88% | 2.30% | 10 |
| 10-Year TIPS* | 1.52% | 1.53% | 2.95% | 10 |
| 30-Year | 3.90% | 3.97% | 2.54% | 30 |
| Sector | ||||
| U.S. Aggregate | 4.68% | 4.68% | 2.72% | 8.6 |
| IG Corps | 5.35% | 5.42% | 3.86% | 11.0 |
| Convertibles | 7.67% | 7.58% | 10.39% | – |
| U.S. HY | 8.27% | 8.96% | 6.61% | 5.1 |
| Municipals | 3.51% | 3.55% | 2.78% | 13.1 |
Source: Bloomberg, FactSet, Standard & Poor’s, U.S. Treasury, J.P. Morgan Asset Management. Sectors shown above are provided by Bloomberg unless otherwise noted and are represented by – U.S. Aggregate; Corporates: U.S. Corporates; Municipals: Muni Bond; High Yield: Corporate High Yield; TIPS: Treasury Inflation-Protected Securities; Convertibles: U.S. Convertibles Composite. Convertibles yield is as of most recent month end and is based on U.S. portion of Bloomberg Global Convertibles Index. Yield and return information based on bellwethers for Treasury securities. Sector yields reflect yield-to-worst. Convertibles yield is based on U.S. portion of Bloomberg Global Convertibles.
JP Morgan Guide to the Markets – U.S. Data are as of July 13, 2023.
References
- 1What are base effects and how do they distort inflation?: Yahoo U
- 2FHN Financial, Bureau of Labor Statistics, Bureau of Economic Analysis as of July 14, 2023
- 3Bloomberg WIRP as of July 17, 2023